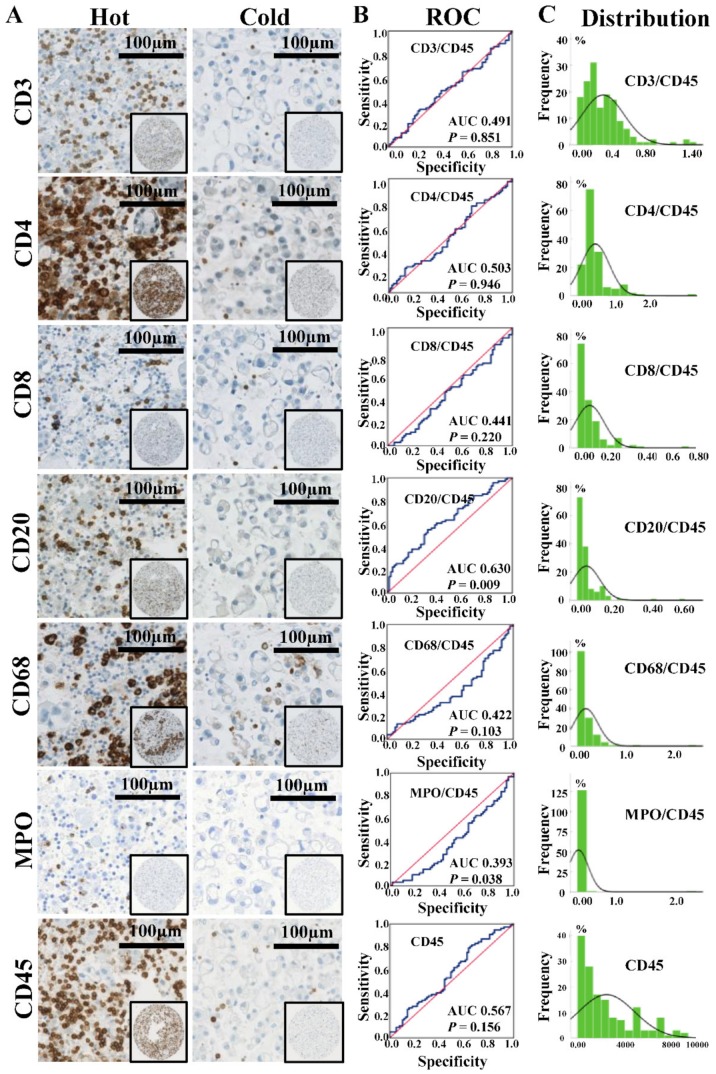
Figure 3.
Expression of each immune cells-specific markers and corresponding receiver operating characteristic (ROC) curves analysis. (A) IHC stainings of immune cells-specific markers, scale bar = 100 µm. “Hot” and “cold” statuses of immune cell infiltration in MPE microenvironment were found among patients. (B) ROC curves analysis of each immune cell type for whole MPE patients. The cut-off value was six months (median overall survival for all MPE patients). (C) Distribution histograms of ratios of immune cells-specific markers to CD45+ leukocytes. The horizontal axis reflects immune cell ratio or cell counting (only for CD45, number/mm2), and the vertical axis reflects the number of samples. Abbreviations: Area under the curve (AUC).

