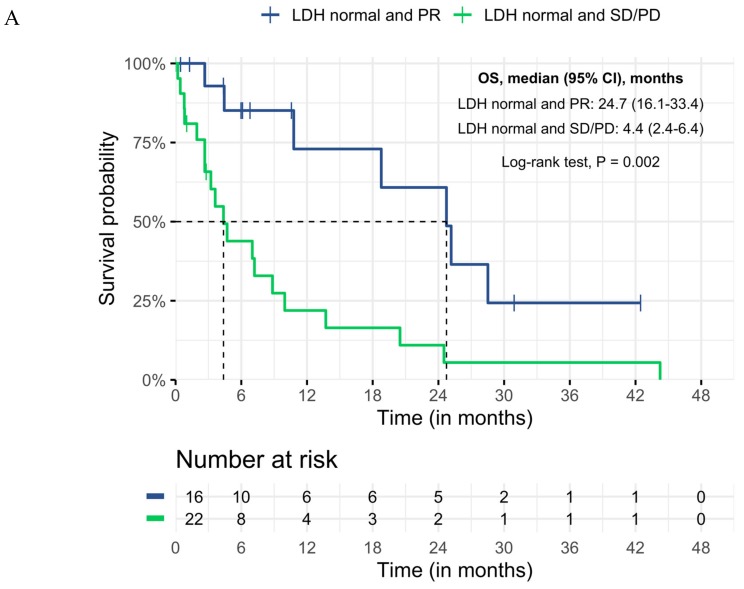
Figure 3.
Differences in Kaplan–Meier curves of overall survival at start of subsequent treatment with ICI, in the subgroup with normalized LDH and PR compared to (A) normalized LDH and SD or PD, (B) all other subgroups, LDH = lactate dehydrogenase, OS = overall survival, CI = confidence interval, PR = partial response, SD = stable disease, PD = progressive disease.


