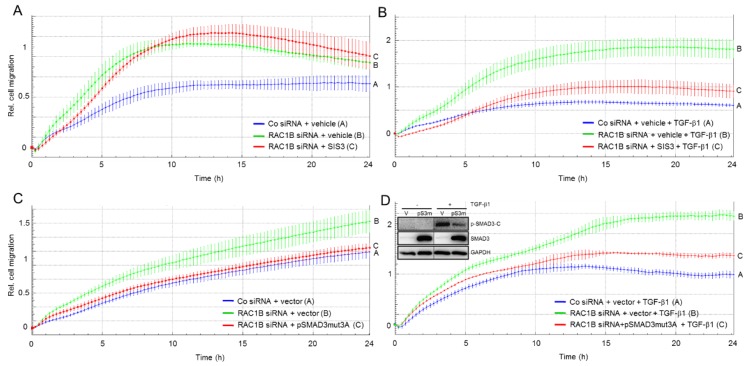
Figure 5.
The effect of inhibitors of SMAD3 activation on basal and TGF-β1-induced cell migration. (A) Panc1 cells were transiently transfected twice with 50 nM of either Co siRNA or RAC1B siRNA and subsequently subjected to migration assay in the presence of either vehicle (0.1% dimethylsulfoxide) or 10 μM SIS3. (B) As in (A), except that all cells received, in addition, TGF-β1. (C) As in (A), except that in addition to RAC1B siRNA Panc1 cells were transfected with either the C-terminal phosphorylation-resistant pSMAD3-mut3A or empty pcDNA3 vector (vector) instead of treatment with SIS3. (D) As in (C), except that the cells were stimulated with TGF-β1. The assays in (A–D) are each representative of three experiments and depict the means ± SD from 3–4 parallel wells. In (B) differences between RAC1B siRNA-transfected and SIS3 + TGF-β-treated cells (red curve, tracing C) and RAC1B siRNA-transfected and vehicle + TGF-β-treated cells (green curve, tracing B) are significant at 1:30 and all later time points (p < 0.05, Mann-Whitney U-test). In (C) differences between RAC1B siRNA + pSMAD3-mut3A-transfected cells (red curve, tracing C) and RAC1B siRNA + vector-transfected cells (green curve, tracing B) are significant at 3:00 and all later time points (p < 0.05, Mann–Whitney U-test). In (D) differences between RAC1B siRNA + pSMAD3-mut3A-transfected and TGF-β1-treated cells (red curve, tracing C) and RAC1B siRNA + vector-transfected TGF-β-treated cells (green curve, tracing B) are significant at 5:00 and all later time points (p < 0.05, Mann–Whitney U-test). Inset, the functionality of pSMAD3-mut3A and SIS3 in blocking the formation of pSMAD3-C after a 1-h treatment with TGF-β1 was verified by immunoblotting.

