Figure 2.
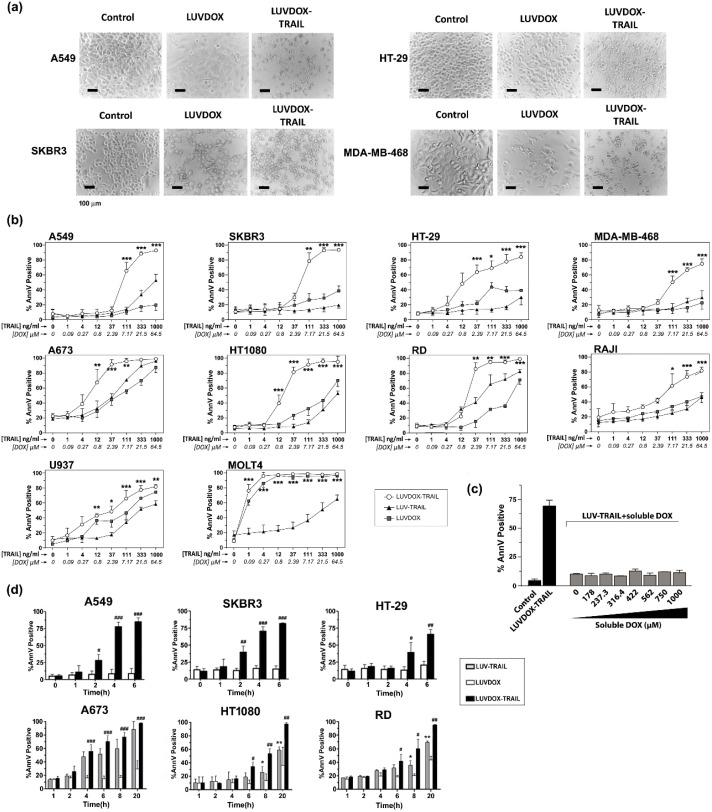
(a) Cytotoxicity of LUVDOX-TRAIL (LDT) on a panel of tumor cell lines from distinct origin. A549, HT-29, SKBR3, and MDA-MB-468 cells were treated with LUV-TRAIL (LT), LUVDOX (LD), or LDT (TRAIL at 1 µg/mL) for 24 h. Bright field microscopy images of the Control, and cells treated with LD and LDT, were taken. Original magnification was 200×. (b) A panel of tumor cell lines (A549, HT-29, SKBR3, MDA-MB-468, A673, HT-1080, Raji, RD, U937, and MOLT4) were treated with increasing concentrations of LT, LD, or LDT for 24 h. The following day, cell death was measured by annexin-V staining. Graphs show the mean ± standard deviation (SD) of at least three independent experiments. * p < 0.05, ** p < 0.01, *** p < 0.001. (c) Combined treatment of LT with increasing concentrations of soluble DOX on A549 cells. A549 cells were treated with LT (1000 ng/mL) in combination with increasing concentrations of soluble DOX for 3 h. Besides, LDT was also used as a reference. Results are the mean ± SD of three independent experiments. (d) Time-course cytotoxicity of LDT on the tumor cell cells: A549, SKBR3, HT-29, A673, HT-1080, and RD cells. Cells were treated with LD or LDT at their maximum concentrations (1 μg/mL TRAIL; 64.56 μM DOX) for the indicated times. Apoptotic cells were measured by annexin-V staining. Graphs show the mean ± SD of four different experiments. * p < 0.05, ** p < 0.01, LT versus LDT # p < 0.05, ## p < 0.01, ### p < 0.001 LD versus LDT.

