Figure 5.

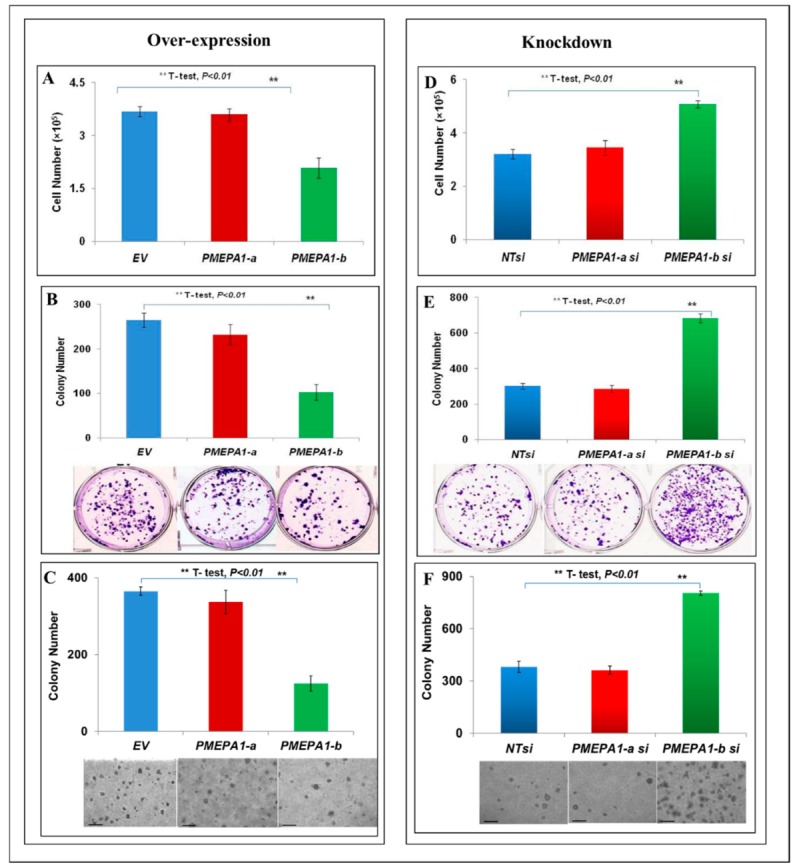
PMEPA1-b inhibited the cell growth, cell plating efficiency and colony formation capacity of LNCaP cells. (A–C) LNCaP cell growth in response to the over-expression of PMEPA1 isoforms (a and b) measured by cell counting (A), cell plating efficiency (B) and colony formation soft agar assay (scale bar = 25 µm) (C). (D–F) LNCaP cell growth responding to siRNA targeting PMEPA1 isoforms (a and b) assessed by cell counting (D), cell plating efficiency (E) and colony formation soft agar assay (scale bar = 25 µm) (F). (G,H) Relative fold changes of the transcription level of PSA (KLK3) in LNCaP cells with PMEPA1-b over-expression (G) and PMEPA1-b depletion (H). (I) Protein levels of AR and PSA in LNCaP cells over-expressing PMEPA1 isoforms (a and b). (J) AR protein level in PMEPA1-b over-expressing HEK293 cells. (K) Association of PMEPA1-b with AR and PSA/KLK3 in prostate cancer tumor samples. The red number highlighted the p value with statistics significance.

