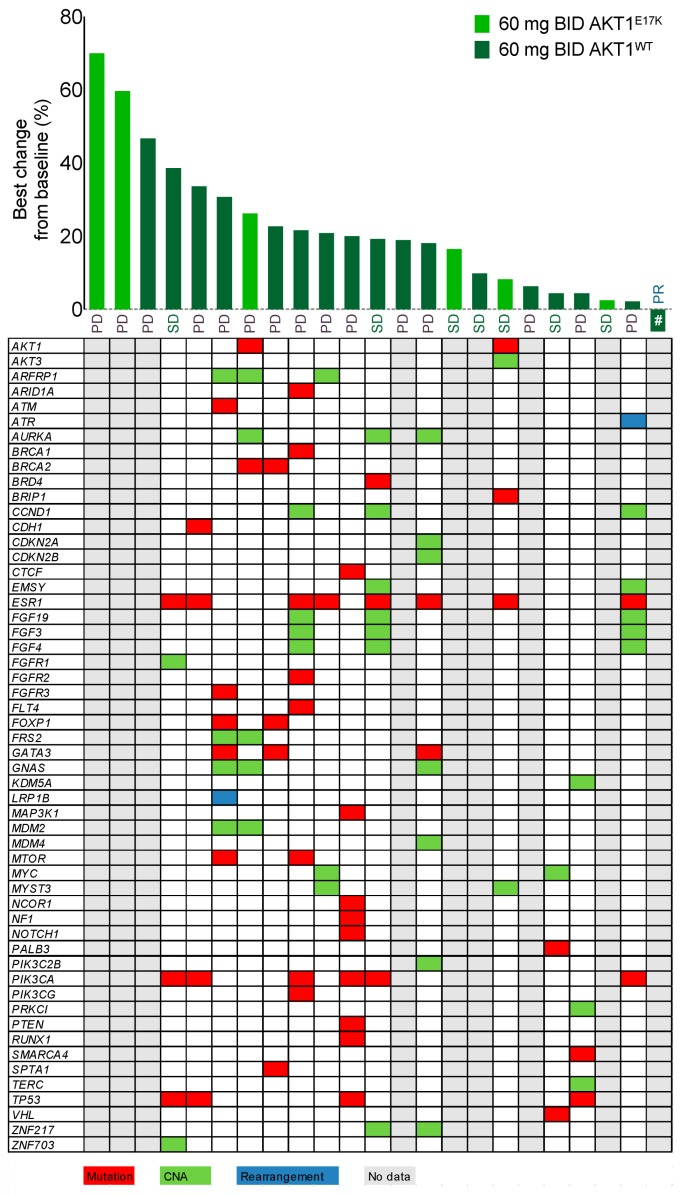
Figure 4.
Waterfall plot showing the best change (%) from baseline and response evaluation according to RECIST v1.1 for patients from the 60 mg BID breast cancer expansion cohort (n = 28) in the BAY 1125976 phase 1 study. The AKT1E17K mutation status for each patient was detected from tumor specimen using the Therascreen assay or based on pre-existing data determined at the investigational site. The table depicts genetic aberrations with known or likely oncogenic properties in the target population as found by next-generation sequencing (NGS) in tumor samples. # indicates the patient who had partial response (−36.5% from baseline). PR, partial response; SD, stable disease; PD, progressive disease. Color indications: Red, mutation; Green, copy number alteration (CNA); Blue, rearrangement; Gray, no data available (failed analysis, low/no tumor content in sample or missing sample).

