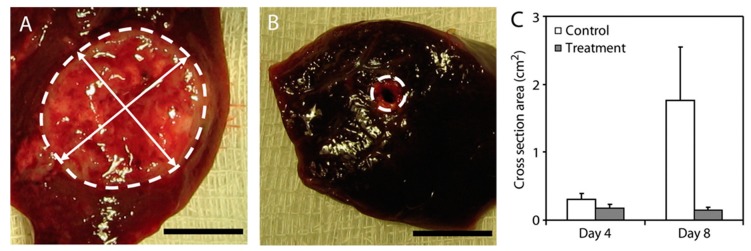
Figure 8.
DOX-containing millirods. Photographs a untreated control (A) and a treated (B) tumor cross section on day 8. The boundary between the tumor and normal liver tissue is indicated with a white dotted outline. The mean cross sectional area of the untreated control and tumors after 4 and 8 days (C). The error bars indicate the standard deviation of each measurement (n = 4). Reprinted and adapted with permission from Wiley, Weinberg et al., Journal of Biomedical Materials Research Part A, 2007 [99].

