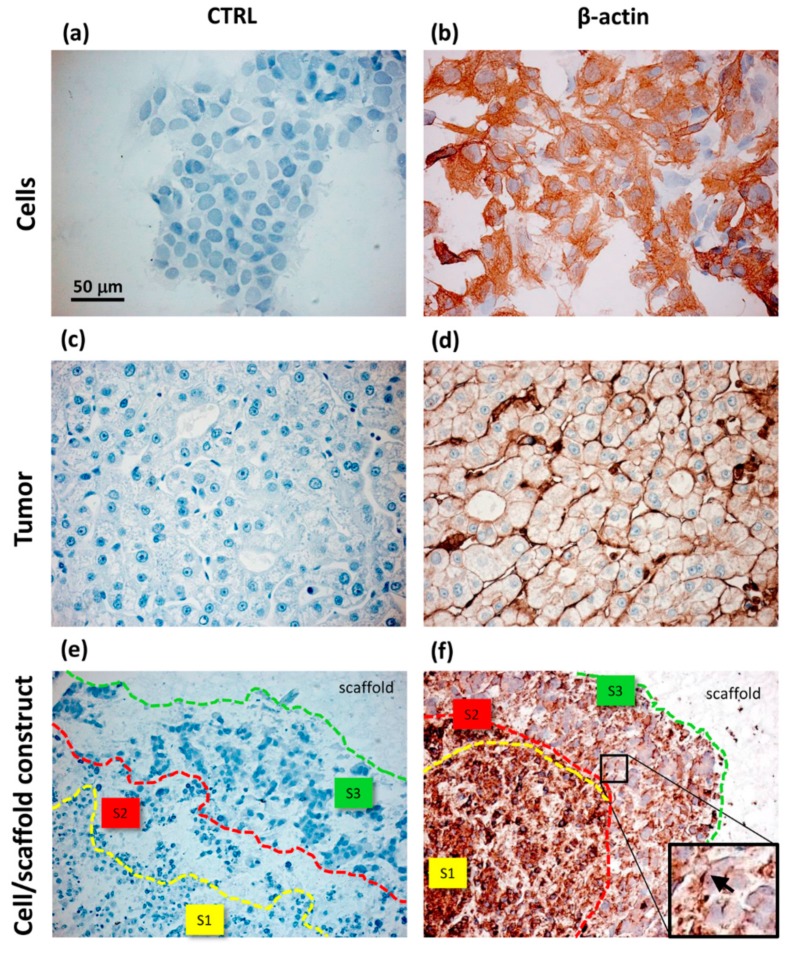
Figure 13.
Immunohistochemical analysis of HepG2 cells cultured in monolayers (a,b); samples of HCC tumor (c,d) and HepG2 cells cultured inside PVA/G hydrogels (e,f). For each sample type, negative controls (a,c,e) and β-actin expression (b,d,f) are shown. S1, S2 and S3 in (e,f) define the areas of different morphotype localization within the cell/scaffold constructs. The insert in (f) shows a few cells with a lamellipodial-like expression of β-actin, indicated with an arrow.MDPI Creative Common Attribution license, Moscato et al., J. Funct. Biomater., 2015 [180].

