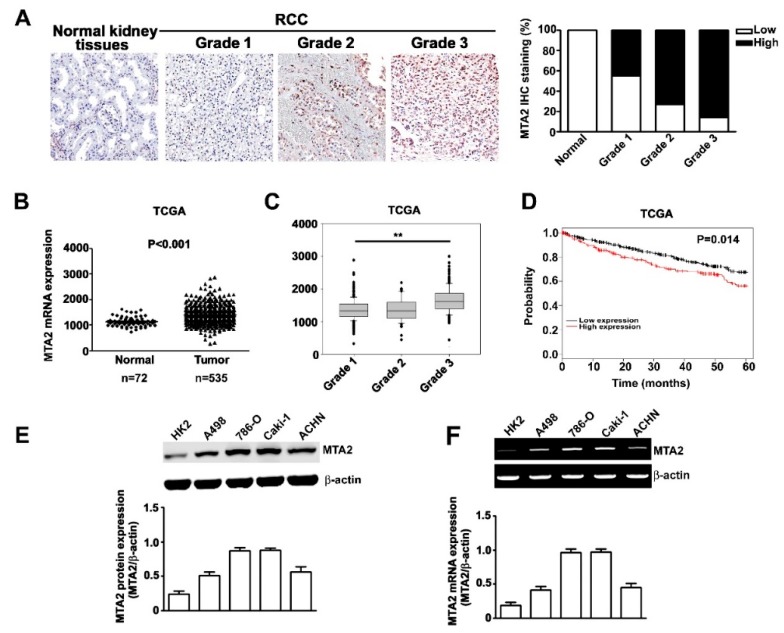
Figure 1.
Expression and effects of metastasis-associated protein 2 (MTA2) in human renal cell carcinoma (RCC) and RCC cells. (A) Intensity of MTA2 expression in RCC grade 1, 2, and 3 and normal kidney tissues by using immunohistochemistry staining (×40). (B) MTA2 mRNA expression of RCC and normal tissue from The Cancer Genome Atlas (TCGA) datasets. (C) MTA2 mRNA expression in patients with RCC grade 1, 2, and 3. (D) Kaplan–Meier curve for overall survival of patients, categorised by low and high MTA2 expression. (E) Total lysates from HK2, A498, 786-O, Caki-1, and ACHN cells were isolated and analysed using western blotting to detect the individual expression of MTA2; β-actin was used as an internal control. (F) A reverse transcription polymerase chain reaction assay was applied to detect MTA2 mRNA expression. β-actin was used as an internal control for mRNA equal loading. Values are expressed as the mean ± SE of three independent experiments. ** p < 0.01 compared with normal kidney tissues.

