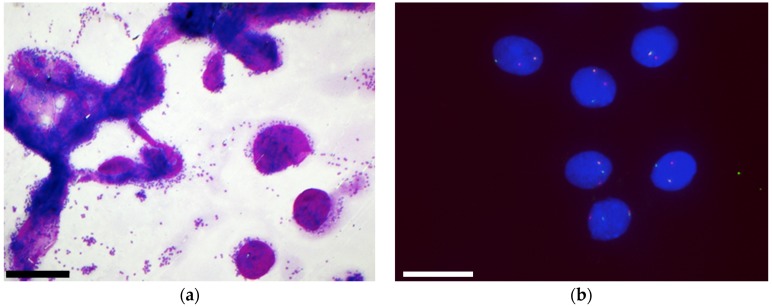
Figure 5.
Malignant tumour: adenoid cystic carcinoma: (a) On the MGG staining, we observed the typical tubular and hyaline globules, (scale bar: 500 µm); (b) FISH performed on the same case revealed rearrangement of the MYB gene as indicated by a split between the green and red signal, (scale bar: 40 µm).

