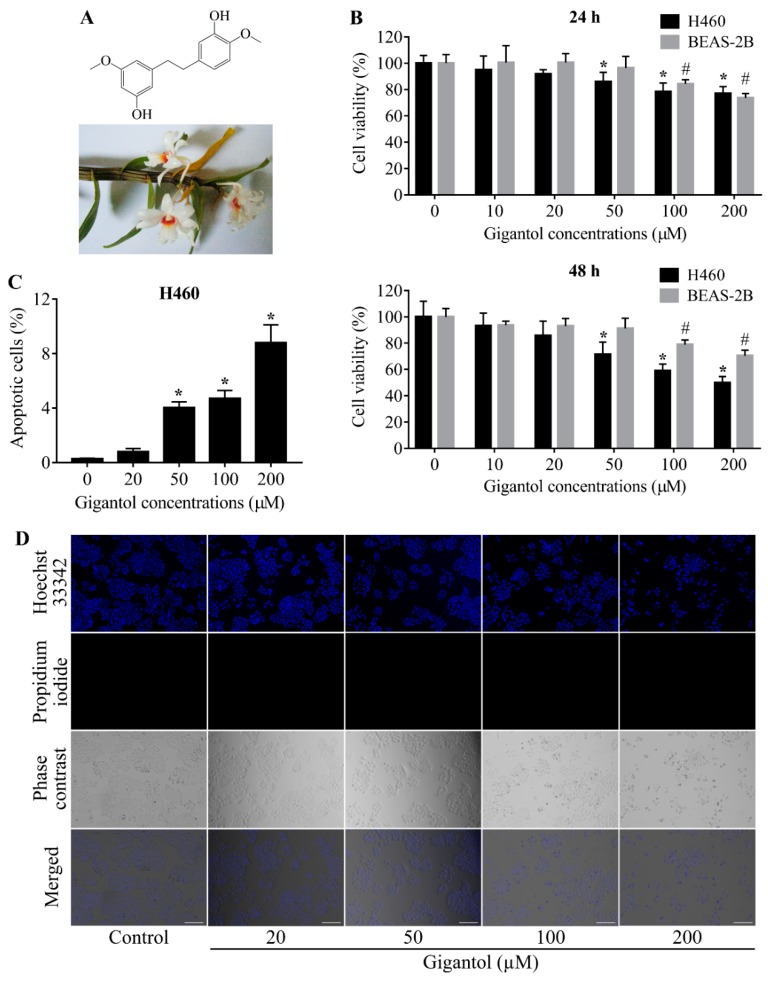
Figure 1.
(A) Gigantol structure and the plant specimen, Dendrobium draconis Rchb.f. (B) Graphs showing the percentages of H460 and BEAS-2B cells viability. Both cell lines were treated with 0 to 200 µM of gigantol or vehicle for 24 to 48 h and then analyzed by MTT assay for cell viability. The percentages of viable cells were compared to their untreated controls. (C) Graph showing the percentages of apoptotic cell death after 24 h of gigantol exposure. Necrotic cells could not be detected. (D) Photographs of Hoechst 33342, Propidium iodide (PI), and phase contrast fields showing cancer cells morphologies after 24 h of gigantol treatment, the scale bars represent 100 µm and the magnification is 100×. Each experiment was performed in biological triplicates, * indicates p < 0.05 as compared with untreated group of H460, # indicates p < 0.05 as compared with untreated group of BEAS-2B (one-way ANOVA, Dunnett’s test).

