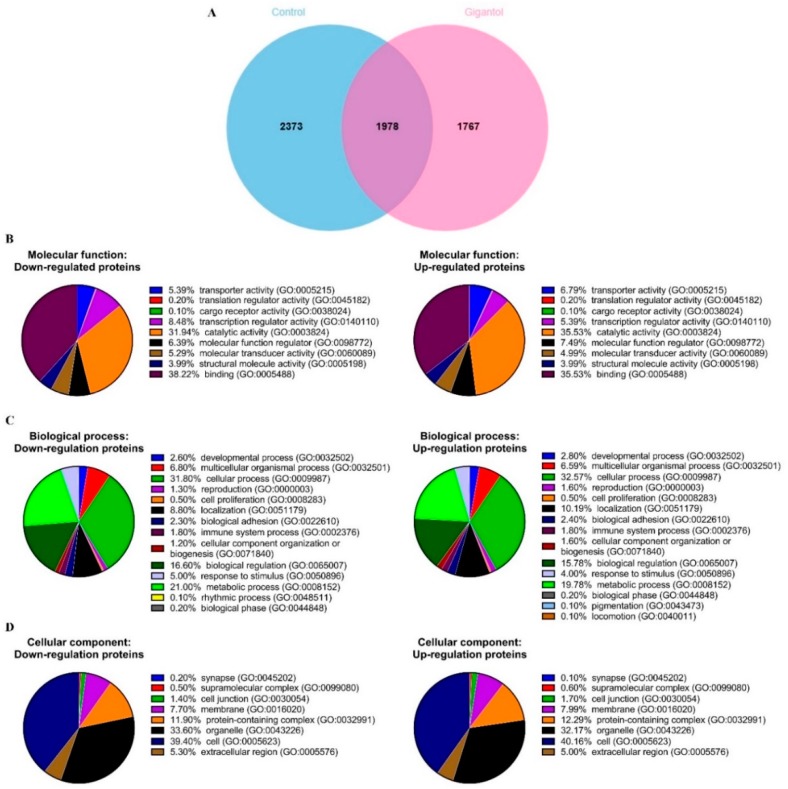
Figure 2.
H460 cells were treated with 20 µM of gigantol or its vehicle (0.004% DMSO) for 24 h before the whole-cell lysates were collected. The experiment was performed in biological triplicates. (A) Venn diagram showing the difference in proteins expressions between the control and gigantol-treated H460 cells. Three functional classifications of the 2373 down- and 1767 upregulated proteins affected by gigantol treatment using Panther software: (B) molecular function, (C) biological process, and (D) cellular component.

