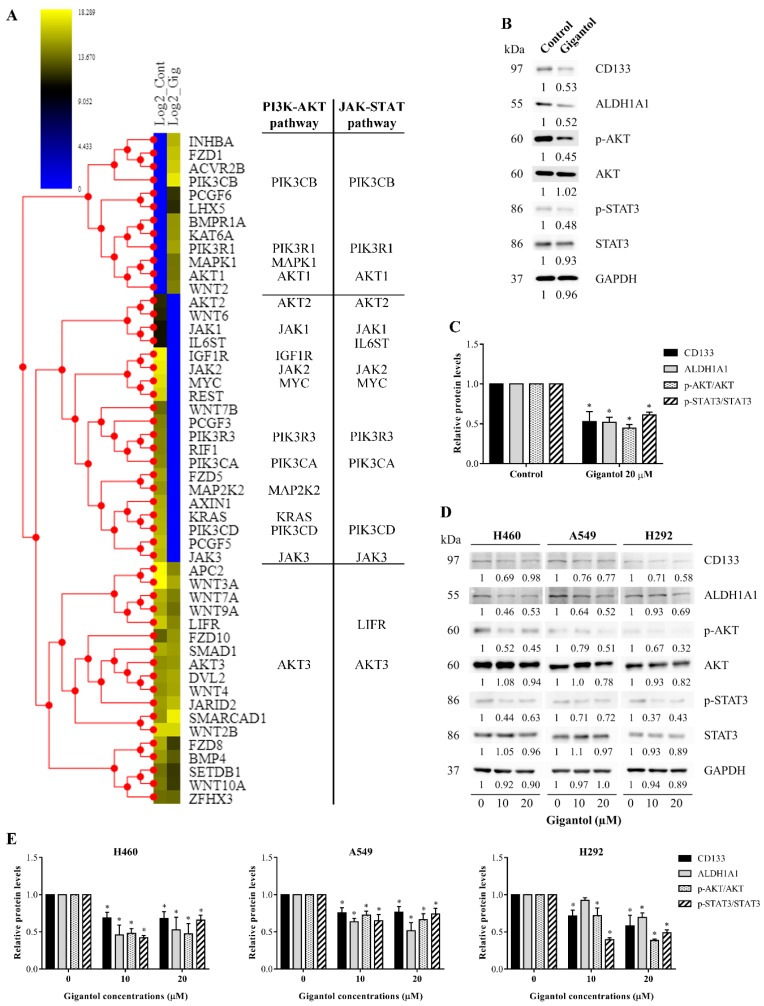
Figure 4.
(A) Heatmap representing the levels of proteins associated with the signaling pathways regulating the pluripotency of stem cells in the control and gigantol-treated H460 cells (left and right columns of the heatmap, respectively). Proteins belonging to each pathway are listed to the right. (B) CSC markers and key kinases of AKT and STAT3 were determined by Western blotting and (C) the immunoblot signal intensities were quantified by densitometry. The uncropped protein bands are in Figure S2 (S2A: The protein bands from Figure 4B; S2B: The protein bands from Figure 4D). (D) The effects of gigantol on AKT, STATS3, and CSC markers were confirmed in two other NSCLC cell lines, A549 and H292, and (E) the relative protein levels were quantified. The mean data from each experiment was normalized to the GAPDH results. The experiment was performed biologically triplicated. Data represent the means ± SD (n = 3) * indicates p < 0.05 as compared with the control group (student’s t-test).

