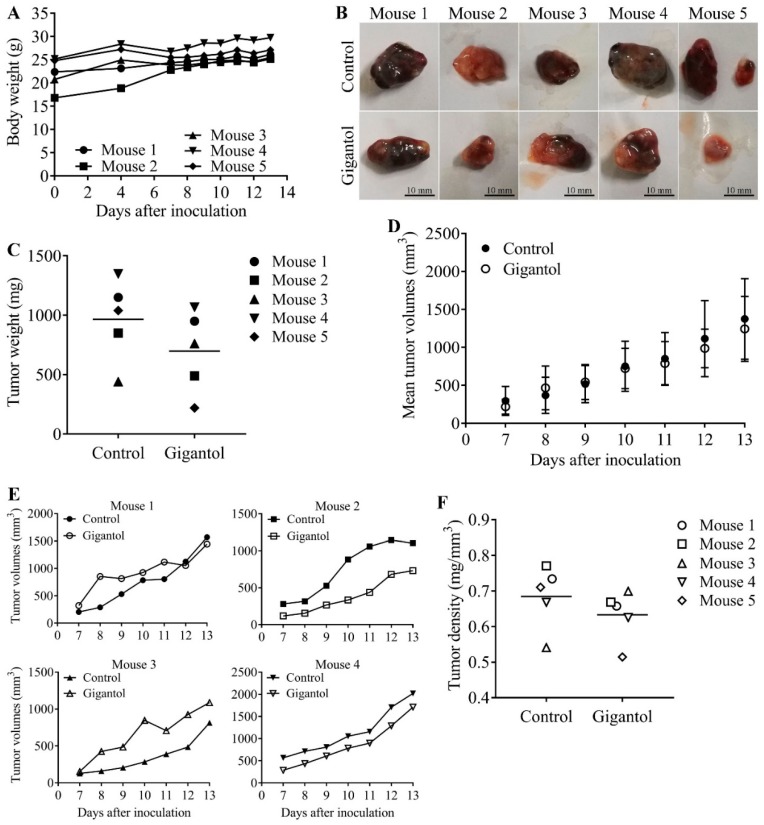
Figure 5.
(A) Graph showing mice body weights starting at the day of cancer cell inoculation. There was no significant change of the body weights until the day of termination. (B) Untreated (upper row) and gigantol-treated (lower row) tumors were dissected and photographed at day 13 after inoculation. Scale bars represent 10 mm in length. (C) Graph showing grouped means of the control and gigantol tumor weights. The 5 different markers represent each pair of tumors. The gigantol-treated tumors had lower tumor weights as compared with their own control tumors, except for mouse 3. (D) Graph presenting the mean growth rate of the control and gigantol groups. (E) Four graphs demonstrating the individual tumor growth rate of each mouse (tumor growth of mouse 5 could not be accomplished because the gigantol-treated tumor was not palpable and measured until the day of termination). (F) Tumor density was calculated as weight by volume. The horizon lines represent means of each group.

