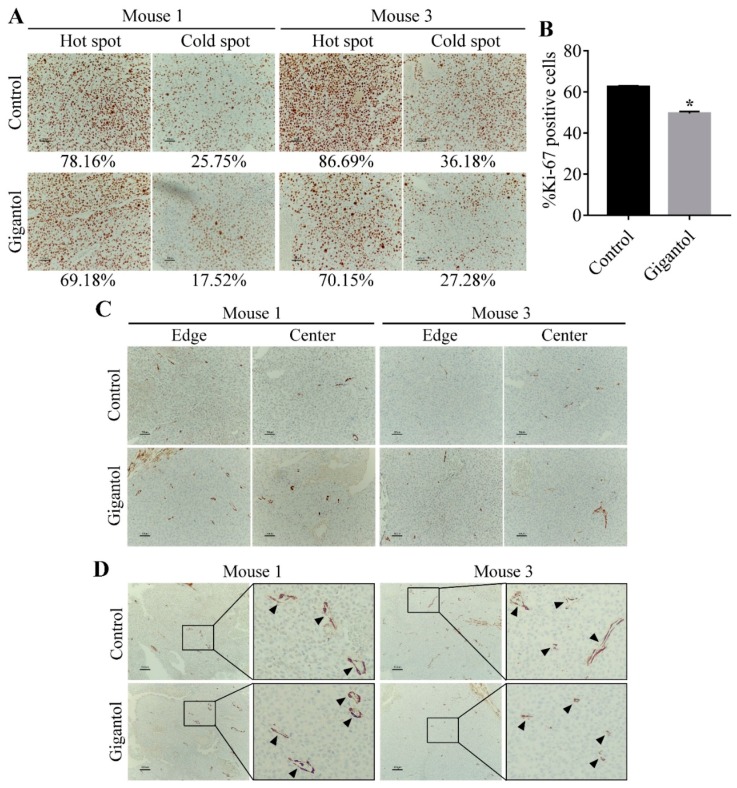
Figure 7.
(A) Immunohistochemistry (IHC) staining demonstrating 200-fold magnified pictures of hot spots and cold spots from the control and gigantol-treated tumors. The percentages of Ki-67 positive cells as compared with total cells are displayed under their pictures. (B) Graph showing the means of %Ki-67 positive cells. The gigantol-treated tumors have lower Ki-67 positive cells than the control tumors. * indicates p < 0.05 as compared with the control group (Student’s t-test). (C) α-SMA IHC staining of cancer cells in both edge and center areas of tumors showing no difference of signal levels (200×). The numbers of mature tumor vessels per areas between the control and gigantol groups were not different. (D) Pictures showing vessel distribution among the tumor mass (100×). Arrow indicates a vessel (400×).

