
Figure 2.
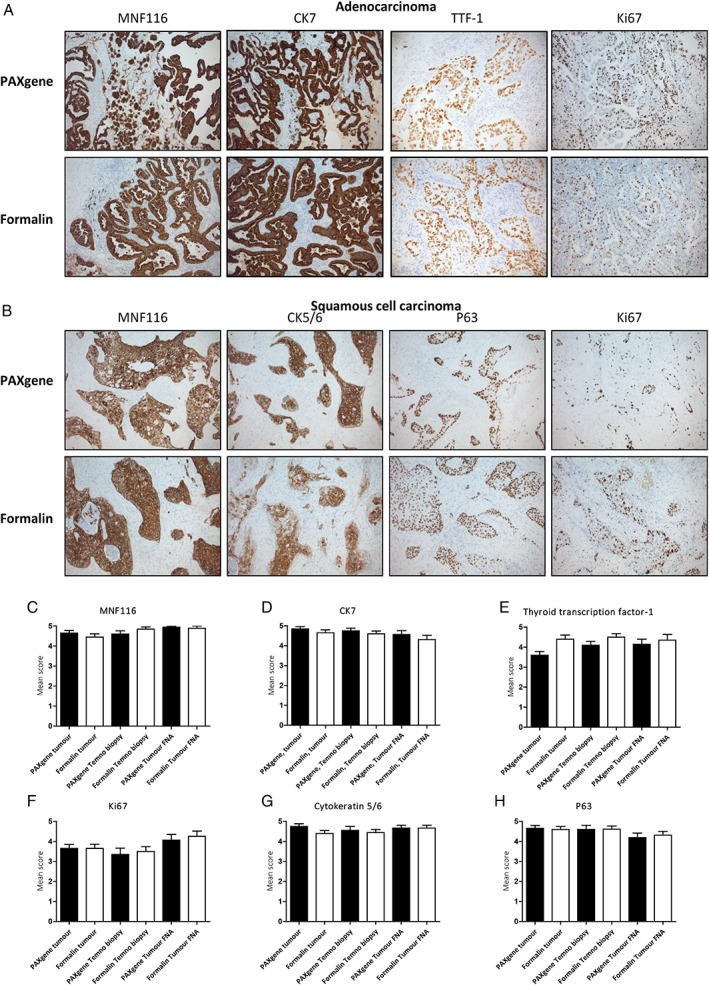
IHC staining. Representative images of PFPE and FFPE adenocarcinoma immunostained with MNF116, CK7, TTF‐1 and Ki67 (A) and squamous cell carcinoma immunostained with MNF116, CK5/6, p63 and Ki67 (B). IHC scores of MNF116 (C), CK7 (D), TTF‐1 (E), Ki67 (F), CK5/6 (G) and p63 (H) were comparable for PFPE and FFPE samples (n = 10).