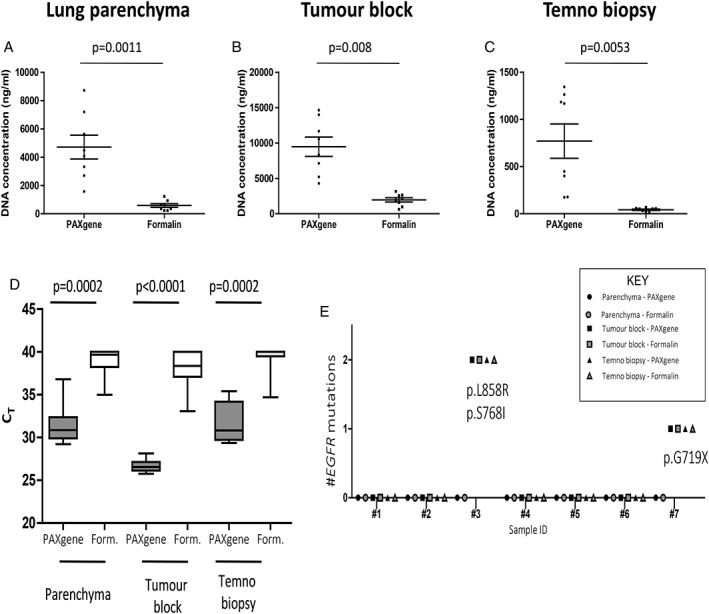
Figure 3.

DNA analysis. DNA concentrations were greater in (A) PFPE lung parenchyma (4714 ± 839.3 ng versus 583.4 ± 125.9 ng, p = 0.0011), (B) PFPE tumour blocks, (9476 ng ±1371 ng versus 1955 ng ± 304.6 ng, p = 0.008) and (C) PFPE Temno biopsies (770.1 ± 181.7 ng versus 42.5 ± 7.44, p = 0.0053), than FFPE comparators. RNA RT PCR mean C T values (n = 8) for β‐actin were lower (D) in PFPE lung parenchyma (31.48 ± 0.8484 versus 38.86 ± 0.6143, p = 0.002), block‐sized tumour samples (26.69 ± 0.2638 versus 38.01 ± 0.8508, p < 0.0001) and Temno biopsies (31.61 ± 0.8326 versus 39.24 ± 0.6544, p = 0.0002) compared to respective FFPE samples. EGFR mutation profiles were explored using the EGFR Therascreen® PCR assay (E). Paired samples from a single subject (Patient #8) were a technical failure and not included. Of the remaining n = 7 subjects, we identified a patient with a p. G719X EGFR mutation present in both PFPE and FFPE tumour blocks and Temno biopsies (and absent in both parenchyma blocks) and another subject harbouring two separate EGFR mutations (p.L858R and p.S768I) present in the block‐sized tumour samples and Temno biopsies but absent in both lung parenchyma indicating similar performance for PFPE and FFPE.
