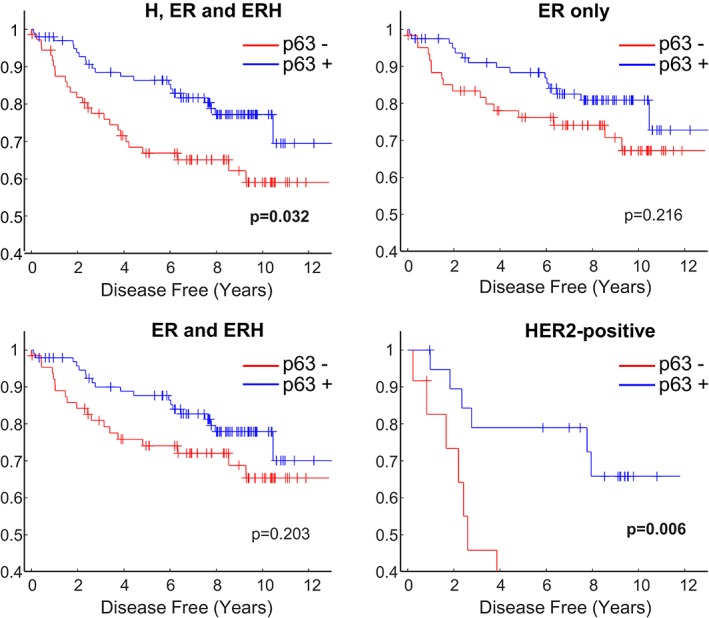
Figure 2.

Kaplan–Meier plots of survival according to the presence or absence of ΔNp63/p40+ tumour cells in ER+/HER2+ breast cancers. Tumours were divided into those that contain a ΔNp63/p40+ population of SMA− cancer cells (p63+; blue lines) and those in which this population was not seen (p63−; red lines) and correlated with disease‐specific survival. ER, ERH and H, tumours that are positive for ER or HER2, either singly or in combination (n = 173); ER only, tumours that are ER+ and HER2− (n = 142); ER and ERH, tumours that are ER+/HER2− or ER+/HER2+ (n = 158); HER2‐positive, HER2+ tumours that are ER+ or ER− (n = 31). P values are Mantel–Cox log‐rank test.
