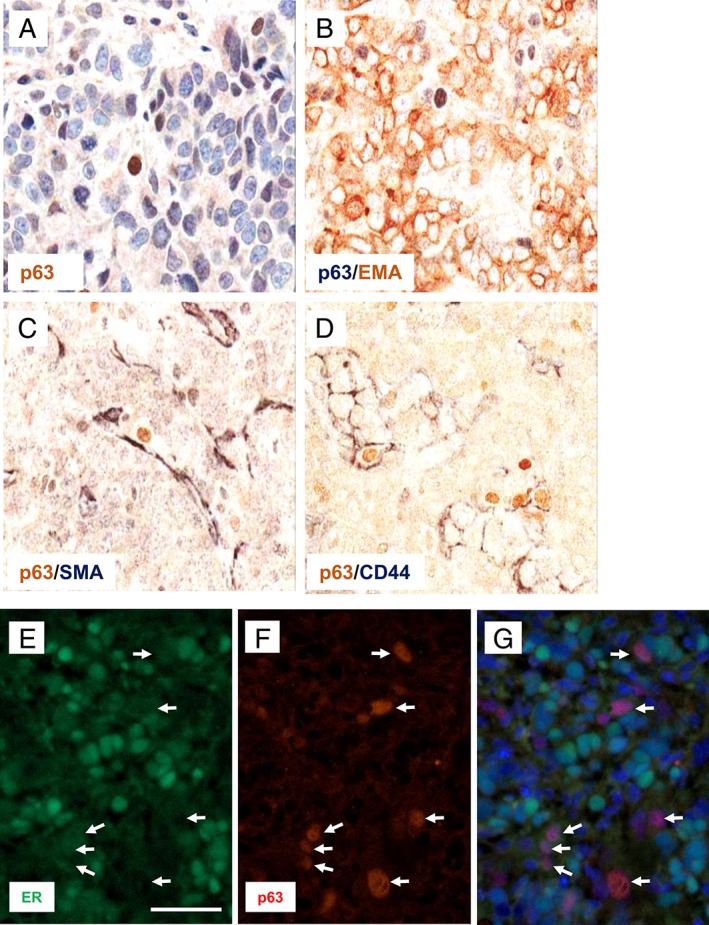
Figure 4.

Localisation and phenotypic characterisation of ΔNp63/p40‐positive cells in MCF7 xenografts. Immunostaining of MCF7 cells grown as xenografts. (A) ΔNp63/p40 (p63) localisation to the nuclei of tumour cells adjacent to the tumour/stroma interface (ΔNp63/p40 in brown with haematoxylin counterstain). (B–D) Dual immunoperoxidase staining for (B) ΔNp63/p40 (p63, blue/grey) and EMA (brown); (C) ΔNp63/p40 (p63, brown) and SMA (blue/grey); (D) ΔNp63/p40 (p63, brown) and CD44 (blue/grey); no counterstain was used. (E–G) Immunofluorescence for ER in green (E) and ΔNp63/p40 (p63) in red (F). (G) The merged image with DAPI counterstain. Arrows indicate ΔNp63/p40+ cells. Scale bar = 50 μm.
