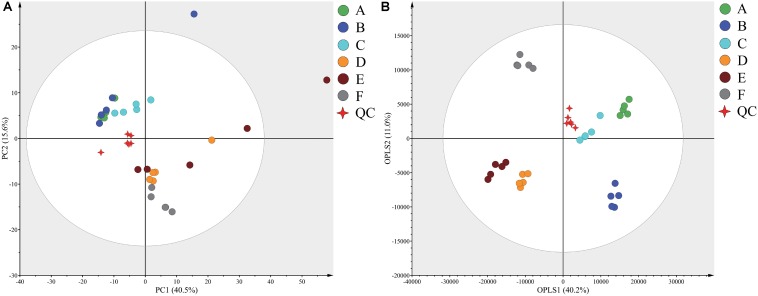
FIGURE 1.
Principal component analysis (PCA) (A) and orthogonal partial least squares discriminant analysis (OPLS-DA) (B) score plots derived from the GC-TOF-MS data from Panxian ham and Quality Control (QC) samples. A–F indicate the traditional spontaneous fermentation process stage of Panxian ham: (A) raw ham; (B) post-salting; (C) post-resting; (D) initial stage of ripening; (E) middle stage of ripening; (F) final stage of ripening. (QC) represents the quality control sample.

