Fig. 4.

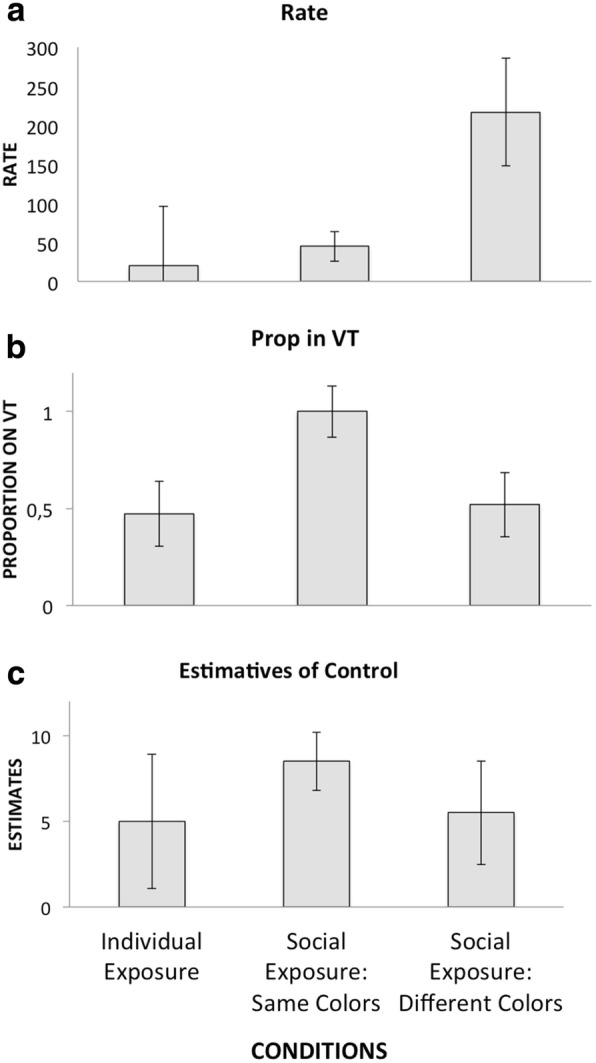
Medians and standard deviations for response rate, proportion of responses in the VT component, and estimates of control in each of the experimental conditions. a Rate. b Prop in VT. c Estimatives of control

Medians and standard deviations for response rate, proportion of responses in the VT component, and estimates of control in each of the experimental conditions. a Rate. b Prop in VT. c Estimatives of control