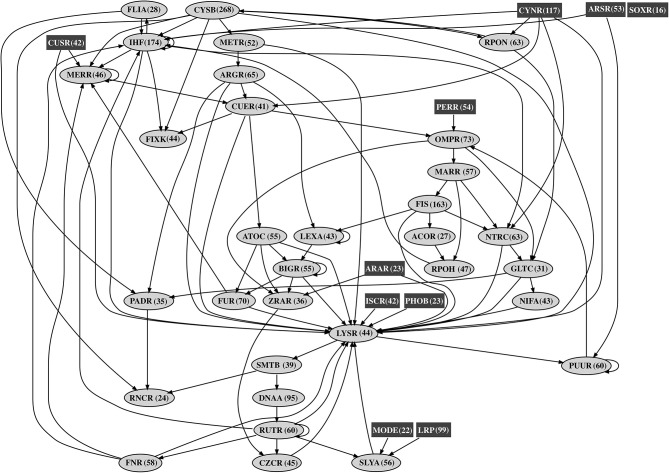
Figure 1.
Acidithiobacillus thiooxidans Licanantay affinity transcriptional regulatory network. The figure shows the interconnectivity (black arrows) between transcriptional factor nodes. Rectangular nodes (dark gray) correspond to transcriptional factors not regulated by others (origons). Oval nodes (light gray) represent transcriptional factors member of chain regulatory cascades. The number in parenthesis next to each transcriptional factor name is the number of operon targets for that transcriptional factor in the affinity network.

