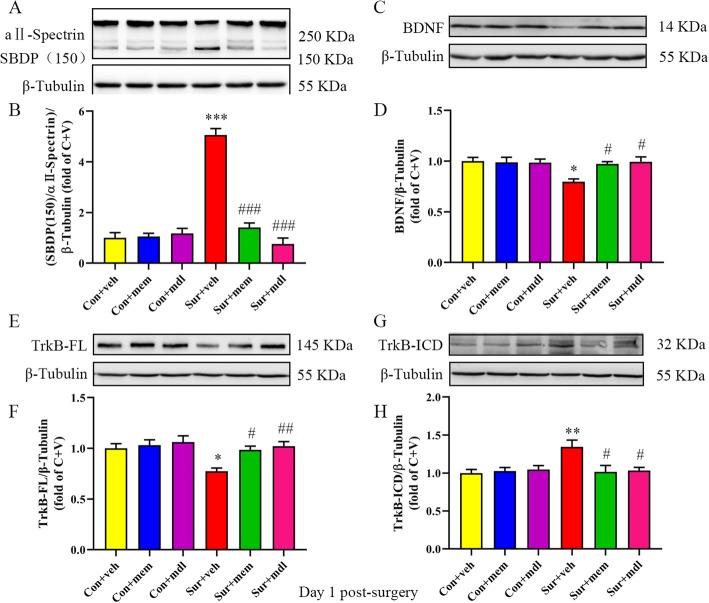
Fig. 6.
Inhibition of NMDAR or calpain restored BDNF/TrkB signaling disruption on day 1 post-surgery. a Representative Western blots of SBDP in the hippocampus. β-tubulin was included as loading control. b Quantitative analysis of the ratio of the SBDP to αII-spectrin. c Representative Western blots of BDNF in the hippocampus. β-tubulin was included as loading control. d Quantitative analysis of BDNF levels. e Representative Western blots of TrkB-FL. β-tubulin was included as loading control. f Quantitative analysis of TrkB-FL levels. g Representative Western blots of TrkB-ICD. β-tubulin was included as loading control. h Quantitative analysis of TrkB-ICD levels. Data are presented as the mean ± SEM (n = 6). *p < 0.05 compared to the con + veh group (**p < 0.01, ***p < 0.001), #p < 0.05 compared to the sur + veh group (##p < 0.01, ###p < 0.001)

