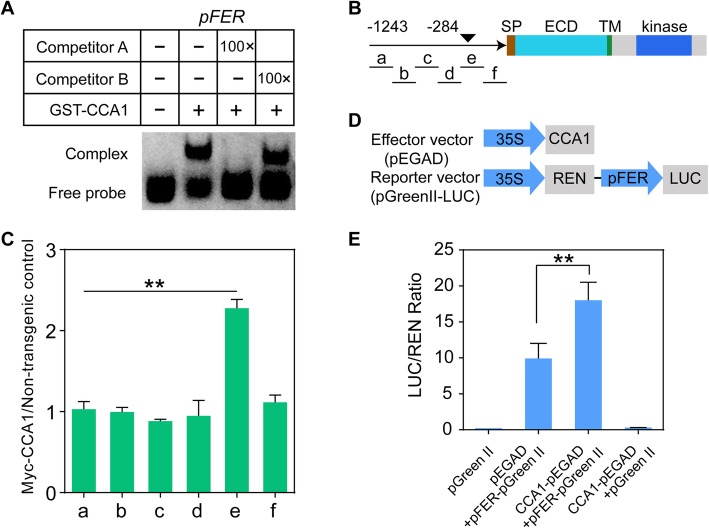
Fig. 2.
CCA1 interacts with the chromatin regions of FER and promotes its expression. a EMSA was performed to confirm the binding of CCA1 to the EE motif of the FER promoter in vitro. Competitor A was the CCA1 binding motif without FITC labeling; Competitor B was the mutant EE fragment without FITC labeling. pFER: The FER fragment contained putative CCA1 binding sites. Sequences of individual DNA probes are listed in Additional file 13: Table 5. The experiments were independently repeated four times with similar results. b Diagram depicting the promoter (arrow), signal peptide (SP), extracellular domain (ECD), transmembrane domain (TM) and kinase domain (Kinase). The black triangles indicate the positions of the EE element (AAATATCT), and the black solid lines depict the DNA regions that were amplified by ChIP-qPCR. c ChIP-qPCR. ChIP assays were performed using an anti-Myc antibody. DNA regions that were amplified by qPCR are indicated by black solid lines in B. Plants were grown under LD conditions and harvested at ZT 0. Values are relative to a non-transgenic control, and three independent experiments were performed with similar results, error bars represent the SD of three biological replicates (**P < 0.01, Student’s t-test). d Reporter and effector constructs used in the transient expression assays. REN luciferase was used as an internal control to normalize the values in individual assays. e Relative reporter activity (LUC/REN) in Arabidopsis protoplasts. Error bars represent the SD of three biological replicates, and asterisks indicate a significant difference (**P < 0.01, Student’s t-test).

