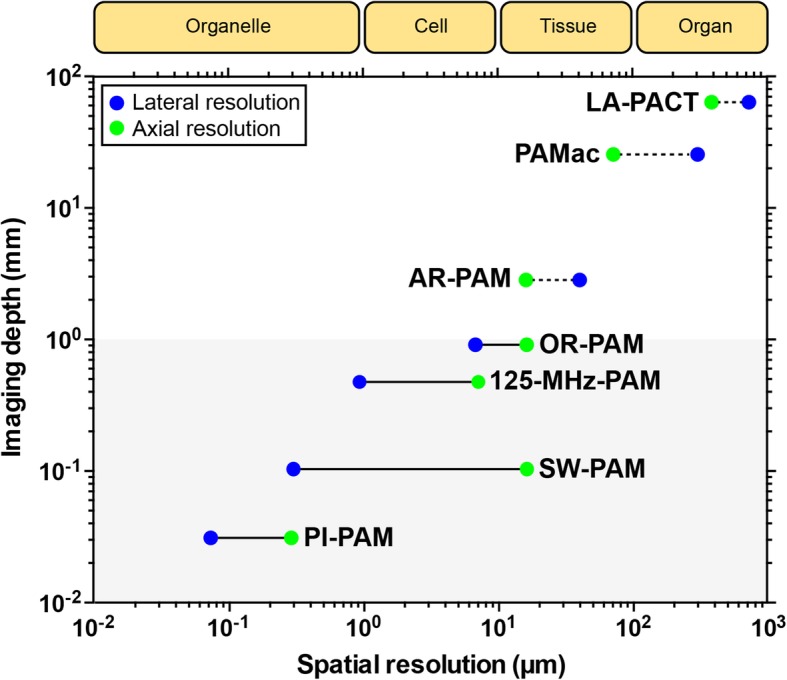
Fig. 3.

Scalability of PAM among multiscale biological systems. The blue circles denote lateral resolution, and green circles denote axial resolution. Solid lines denote OR-PAMs, and dotted lines denote AR-PAMs. LA-PACT, linear-array PA computed tomography [37]; PAMac, PA macroscopy [38]; AR-PAM, acoustic resolution PAM [39]; OR-PAM, optical resolution PAM [40]; 125-MHz-PAM, PAM using a 125-MHz ultrasound detector [41]; SW-PAM, subwavelength resolution PAM [42]; PI-PAM, photoimprint PAM [43]. Figure adapted from [44]
