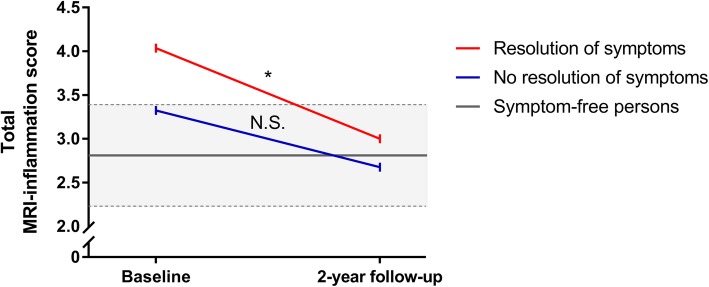
Fig. 4.
Mean total MRI inflammation scores over time for patients with and without resolution of symptoms (N = 82). The grey area indicates the mean and 95% confidence interval (dashed lines specify the upper and lower limit of the interval) of the total MRI inflammation score in age-matched symptom-free persons. Considered in this figure are patients with a baseline total MRI inflammation score > 0. At baseline, in the group without resolution of complaints, the mean total MRI inflammation score was not different as compared to symptoms-free persons (p = 0.26). Patients with resolution did have higher scores than symptoms-free persons (p = 0.04). After the 2-year follow-up, patients without and with a resolution of symptoms both did not have higher scores (p = 0.68 and p = 0.57, respectively). *Significance at the p < 0.01 level; N.S., non-significance

