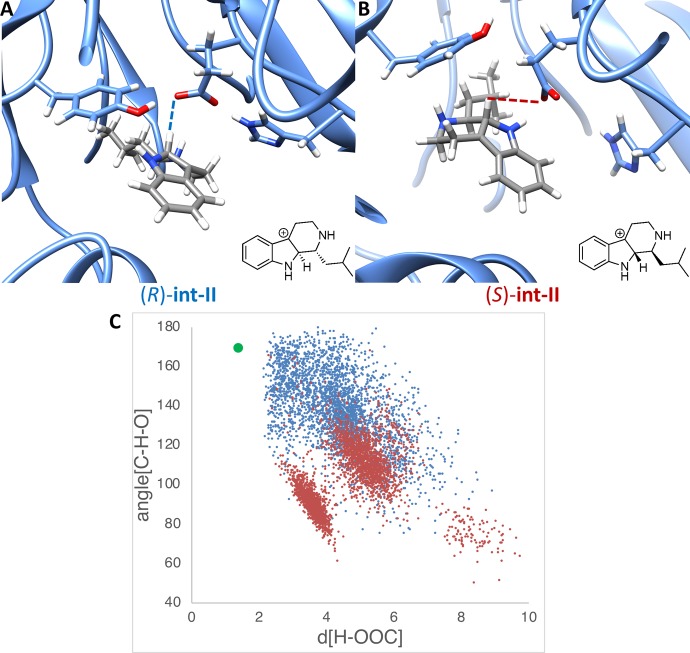
Figure 5.
Results from MD simulation with (S)- and (R)-strictosidine-int. (A) Snapshot of MD trajectory of (S)-strictosidine-int. (B) Snapshot of MD trajectory of (R)-strictosidine-int. (C) Plot of hydrogen (of (R/S)-strictosidine-int) to oxygen (of glutamate) distances vs time in nanoseconds throughout the MD trajectory. The blue line represents the distance for (S)-strictosidine-int and the red line represents the distance for (R)-strictosidine-int.

