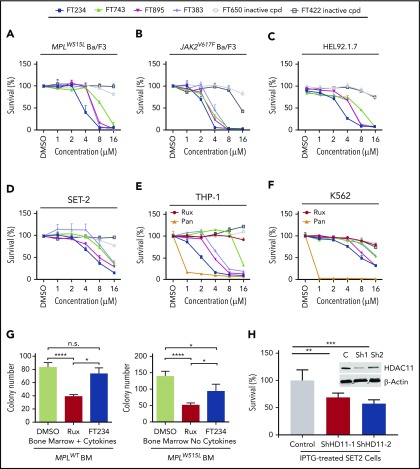
Figure 2.
HDAC11 inhibition or silencing suppresses MPN cell survival. (A-D) CCK8 assays were performed to assess survival of mouse and human MPN cell lines, (A) MPLW515L-expressing Ba/F3 cells, (B) JAK2V617F-expressing Ba/F3 cells, and (C) HEL92.1.7 human MPN cells and (D) SET-2 cells treated with several HDAC inhibitors showing various selectivity profiles against HDAC11 (FT234, FT743, FT895, and FT383) or inactive compounds (FT650 and FT422) for 48 hours. Chemical structures not previously published for FT906 (HDAC6/HDAC11) and FT234 (HDAC11) are shown in supplemental Figure 3A-B. Similar experiments described in panels A-D using additional ruxilitinib (Rux) and panobinostat (Pan) treatment of (E) THP-1 and (F) K562 cells. (G) Colony counts from MPLWT or MPLW515L-expressing BM with cytokines to support normal colony growth or without cytokines for expansion of malignant colonies. MPLWT have no colony formation in the absence of cytokines. Supporting data are shown in supplemental Figure 3F for percent GFP and WBC counts of these mice on the day of BM isolation. (H) Inducible non-target control (C) of 2 different HDAC11 shRNAs (Sh1 and Sh2) stably expressed in SET-2 cells was assessed for impact on cell viability using acridine orange (live) and propidium iodine (dead) stain after induction with isopropyl β-D-1 thiogalactopyranoside (IPTG). Western blots conducted to assess HDAC11 protein levels in these cells are shown in the insert. Supplemental Figure 3G shows transient shRNA HDAC11 knockdown in SET2 cells and in JAK2V617F Ba/F3 cells. All experiments were repeated 3 or more times. Statistical analysis was performed using analysis of variance (ANOVA) and P values are indicated. Statistical analysis by two-tailed unpaired Student t test. ****P < .0001; ***P < .001; **P < .01; *P < .05.

