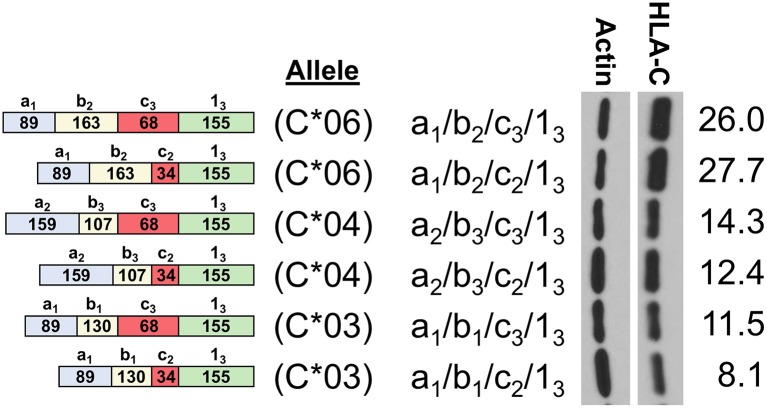
Figure 4.
HLA-C*06 is expressed at markedly higher levels than -C*03 and -C*04 alleles. The exon content of each HLA-C cDNA is listed and shown schematically on the left. The results of Western blotting of transfected JAR cells is shown in the panel on the right. ImageJ normalized lane intensities are indicated on the right. The results shown are representative of three independent experiments performed.

