
Fig. 1.
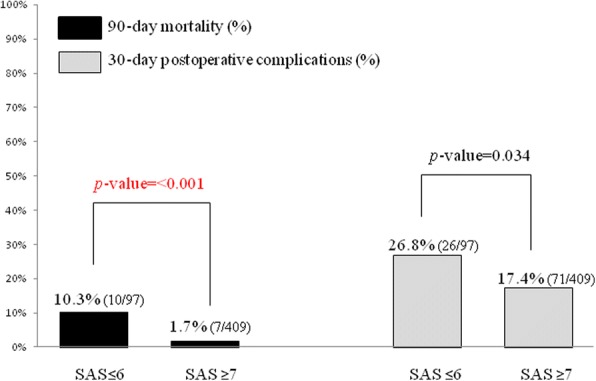
The relationship between the SAS value and the 90-day mortality and 30-day postoperative complications. Patients were divided into two groups: the low-risk group (SAS ≥ 7) and high-risk group (SAS ≤ 6). Black bar: The 90-day mortality in each group. Gray bar: 30-day postoperative complications