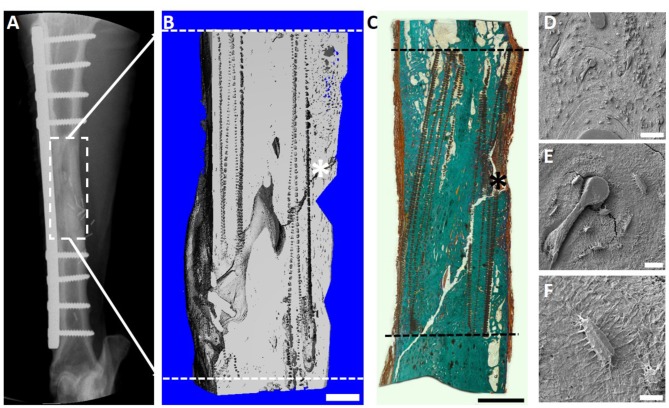
Figure 9.
Overview of the 6 cm tibial corticoperiosteal flap results. (A) X- ray image at 12 months' time point. (B) Sagittal plane of the μCT 3D reconstruction. (C) Undecalcified resin section stained with Goldner's trichrome showing excellent osteointegration of host bone, scaffold and newly formed bone. (D–F) Scanning electron microscopic (SEM) images showing the osteocyte network of the newly formed tissue. (D) Osteointegration of new formed bone in the middle of the defect site. (E) Higher magnification image showing secondary osteon formation and osteocytes in the proximity of the osteon's central blood vessel and (F) higher magnification of an osteocyte embedded in the newly formed bone matrix. - - - Defect site; Scaffold collapse in C resulting from sample processing; *Mechanical testing fissure artifact; Scale bar: (B) 5 mm; (C) 10 mm; (D) 100 μm; (E) 50 μm and (F) 10 μm.

