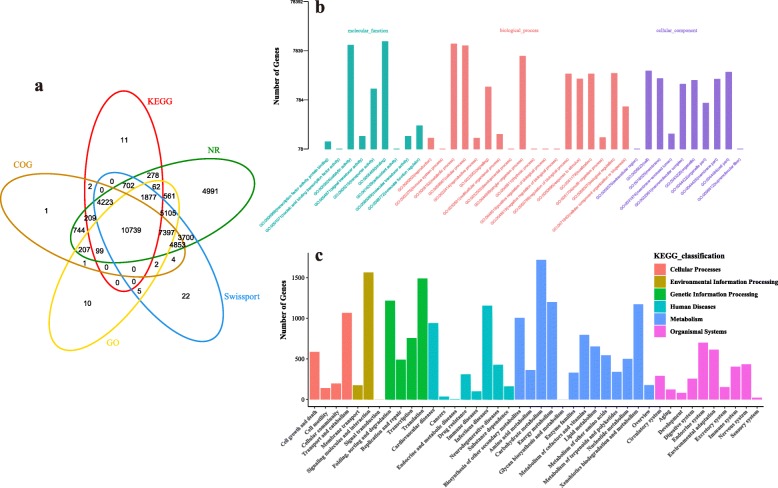
Fig. 2.
Annotation and functional classification of unigenes. a Venn diagram of unigenes functionally annotated for leaves and fruits. b Annotation of the GO database. The x-axis is the GO classification of gene function and the y-axis is the number of genes in the annotation. c Classification of KEGG annotation. The x-axis is the classification of gene function and the y-axis is the number of genes in the interpretation

