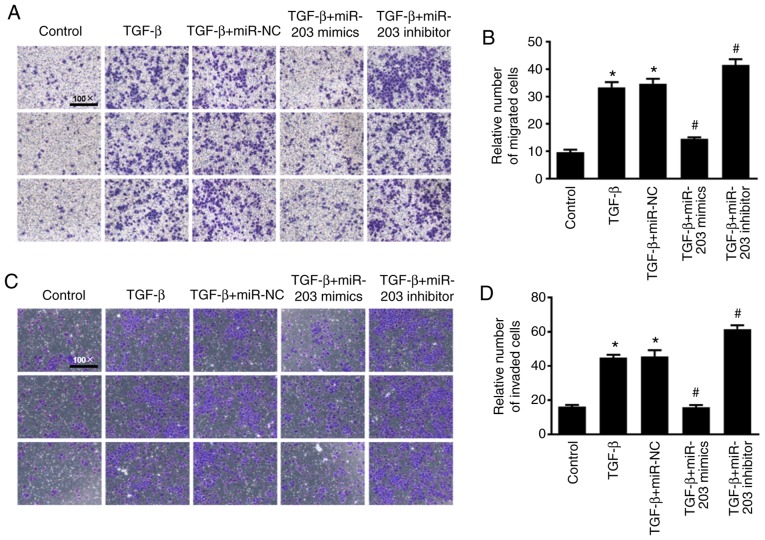
Figure 4.
(A) Transwell cell migration assay. (B) ImageJ quantified the relative number of migrating cells. (C) Transwell cell invasion assay. (D) ImageJ quantified the relative number of invading cells. *P<0.5, compared with the control group, #P<0.5, compared with the TGF-β+miR-NC group. TGF-β, transforming growth factor.

