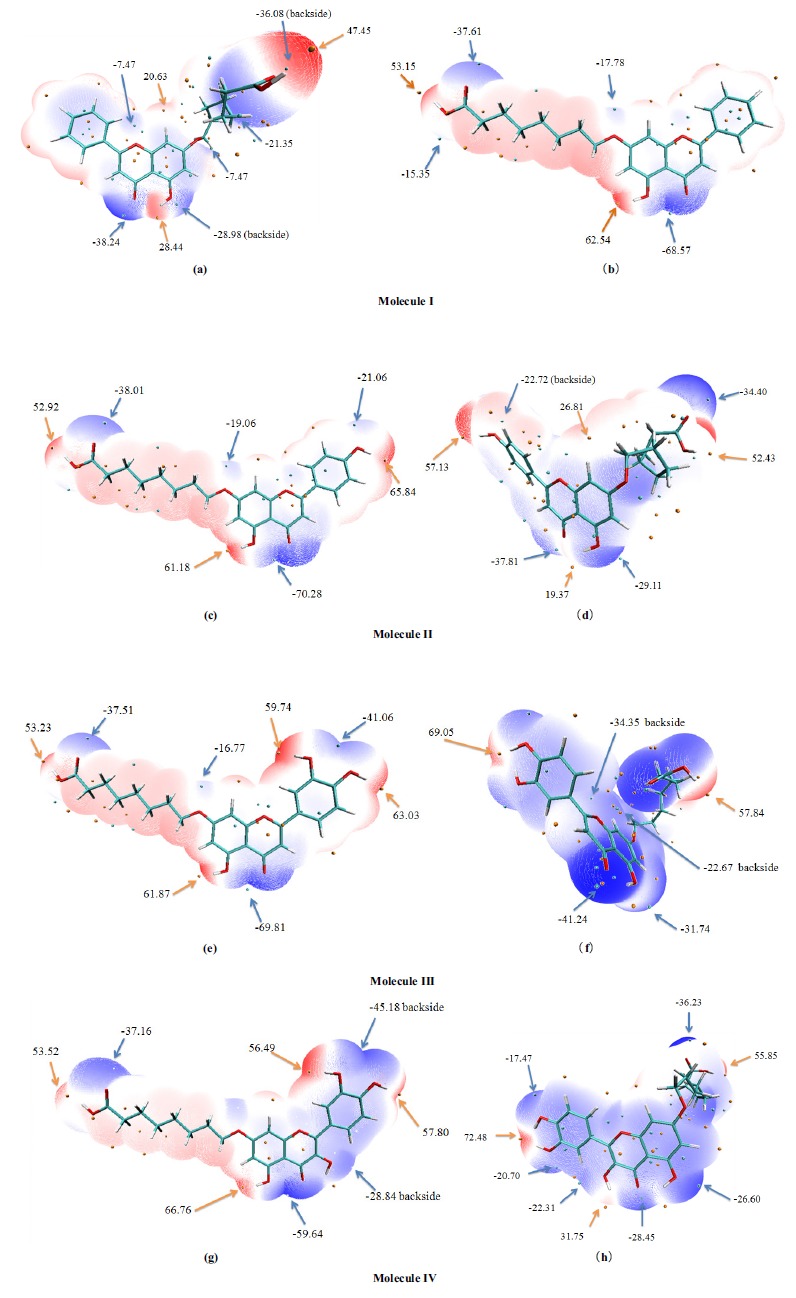
Fig. (7).

Molecular electrostatic potential on vdW surface of molecules I~IV (a-h). The unit is in Kcal/mol. Surface local minima and maxima of molecular electrostatic potential are represented as blue and orange spheres, respectively. The local surface maxima values and the global minimum and maximum are labeled by bold font. (A higher resolution / colour version of this figure is available in the electronic copy of the article).
