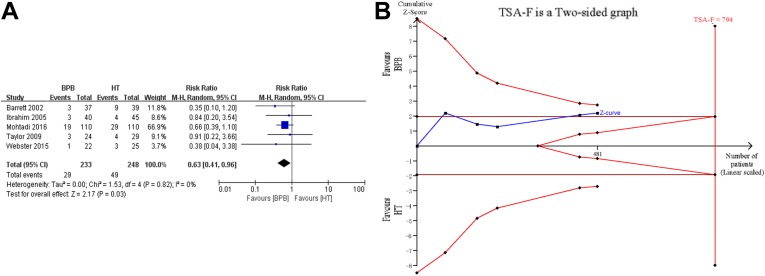
Figure 2.
(A) Traditional analysis of graft failure rate. Risk ratio for graft failure was in favor of BPB (95% CI, 0.41-0.96; P = .03). (B) Trial sequential analysis of graft failure rate. The Z curve crossed the conventional boundary (horizontal brown lines), suggesting the superiority of BPB, but failed to cross the 2-sided significance testing boundaries, futility boundaries, and trial sequential monitoring boundaries (red curves). The sample size of included studies also did not reach the required number (vertical red line). BPB, bone–patellar tendon–bone; HT, hamstring tendon; M-H, Mantel-Haenszel; TSA-F, trial sequential analysis–.

