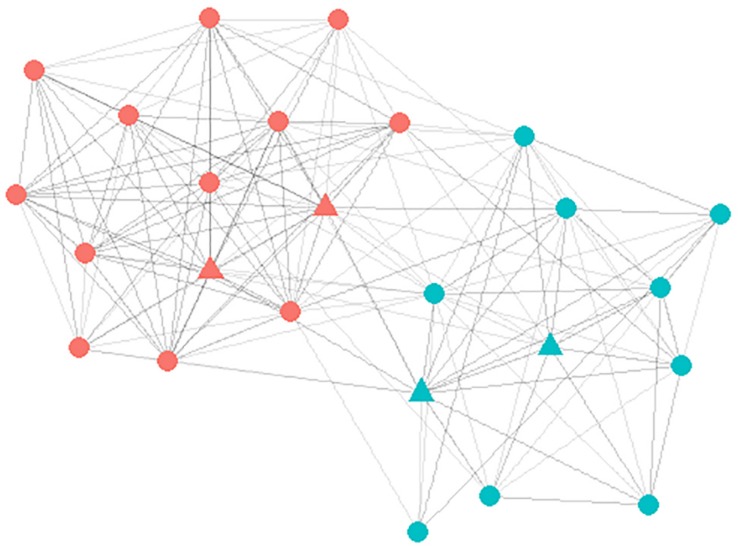
FIGURE 2.
Visual representation of the social network of one of the social network intervention classes. The dots represent the participant (nodes) and the lines between the dots represent the connection (edges). The blue nodes are males and the red nodes are female. The targeted influence agents are marked by a triangle.

