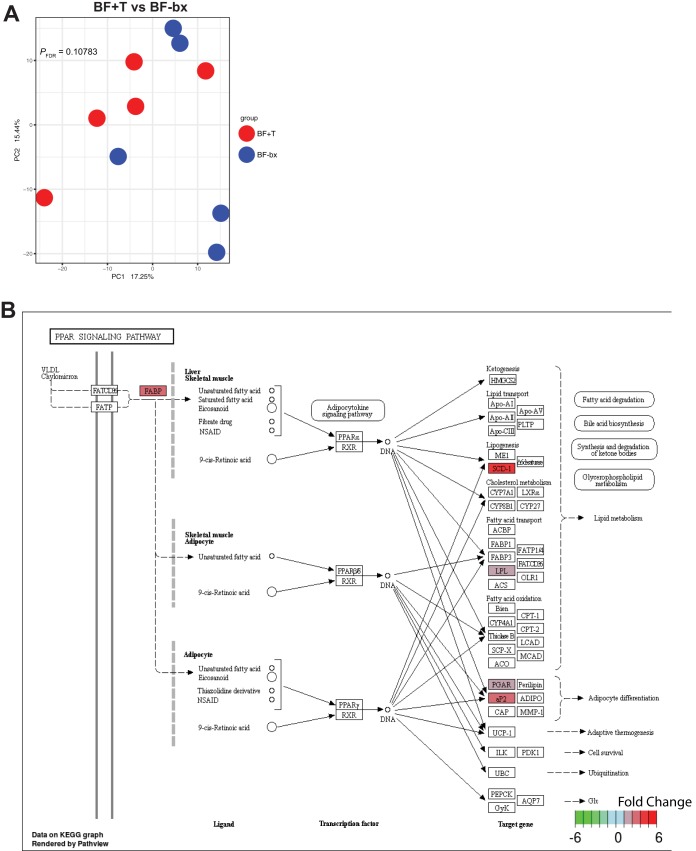
FIG 2.
Mouse gene expression affected by biofilm status. (A) PCA of mouse transcriptomes from BF+T and BF-bx mice (N = 5 per group). (B) PPAR signaling pathway depicting genes significantly increased in BF+T associated mice in red. See Table S2 at https://figshare.com/s/4b593b780f756a4acf69 for a list of all significant DE genes in BF+T versus BF-bx associated mice. Boxes without color denote no significant change.

