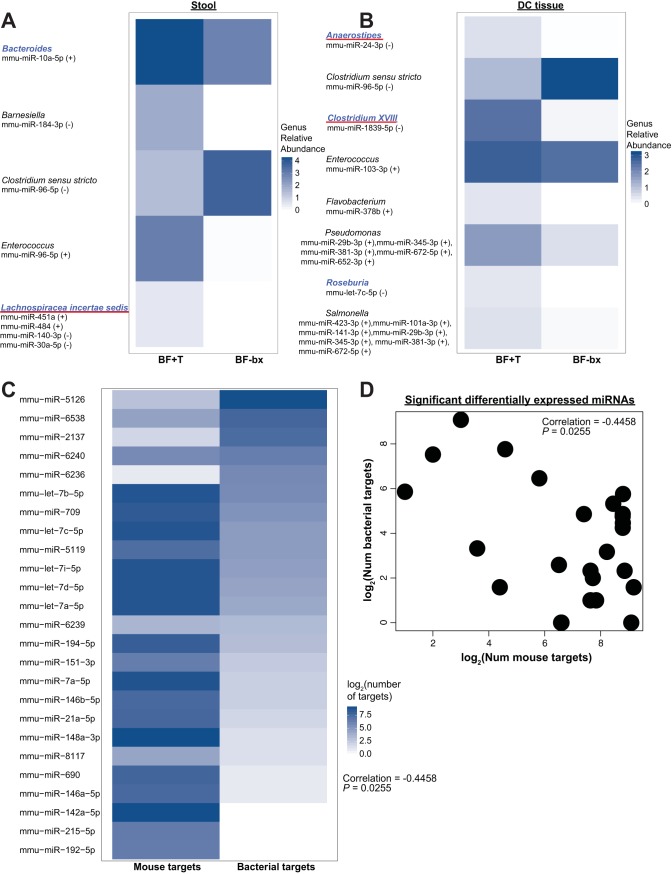
FIG 4.
Microbial relative abundance at the genus level correlates with specific miRNAs. (A and B) Heatmap depicting the mean log10-normalized relative abundance of genera within the stool (A) or distal colon tissue (B) compartments that have significant (PFDR < 0.05) correlation with miRNA expression. The name of each miRNA is shown below the genus it correlates with. Genera in blue font are significantly different between BF-bx and BF+T ApcMinΔ850/+;Il10−/− mice. The red underlined genera were significantly different based on biofilm status in both the initial association and reassociation experiments. The direction of correlation is shown within parentheses. Relative abundance data are from the subset of BF-bx and BF+T mice that were used for miRNA sequencing (n = 7 for BF-bx; n = 10 for BF+T). See Tables S10 at https://figshare.com/s/55e156ec52d9d3e53394 and S11 at https://figshare.com/s/1c47b438d806062915c9 for the full list of miRNAs that correlate with bacterial taxa and the corresponding correlation coefficients. (C) Heatmap comparing the log2-transformed number of predicted bacterial versus mouse gene targets for the miRNAs that were significantly DE between the GF, BF-bx, or BF+T group. There is a significant negative correlation (Pearson) between the number of predicted bacterial versus mouse gene targets for the set of significant DE miRNAs. (D) Scatter plot demonstrating the significant negative Pearson correlation between the log2-transformed number of mouse versus bacterial gene targets where each circle represents a unique mouse miRNA that was significantly DE between GF, BF-bx, or BF+T group.

