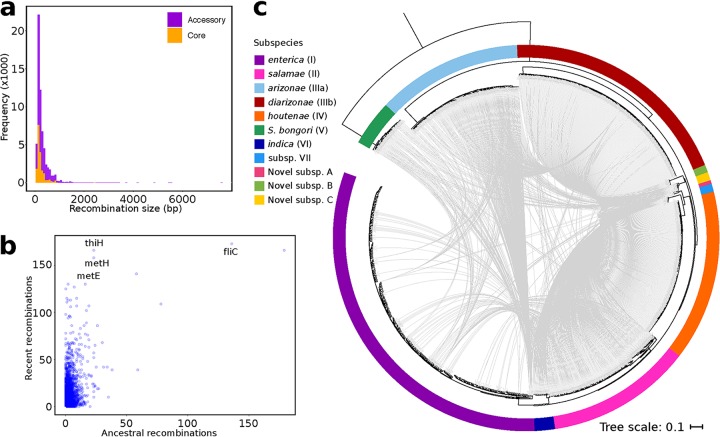
FIG 3.
Variable patterns of recombination. (a) Size distribution of lengths of recombined core and accessory DNA fragments. (b) Genes that have undergone recent or ancestral recombination. The horizontal axis shows the estimated number of ancestral recombinations, and the vertical axis shows the estimated number of recent recombinations. For clarity, names of some of the most frequently recombined genes with known functions are shown. (c) The maximum likelihood phylogenetic tree was calculated using the concatenation of 1,596 core genes present in all 926 genomes and rooted using S. bongori. The scale bar represents nucleotide substitutions per site. The outer ring shows the different subspecies identified by Alikhan et al. (12). For visual clarity, only intersubspecies highways of recombination events identified by fastGEAR are shown (as gray arrowlines), and nonhighway recombination pairs are not shown. Inferred recipient genomes are indicated by the arrowheads.

