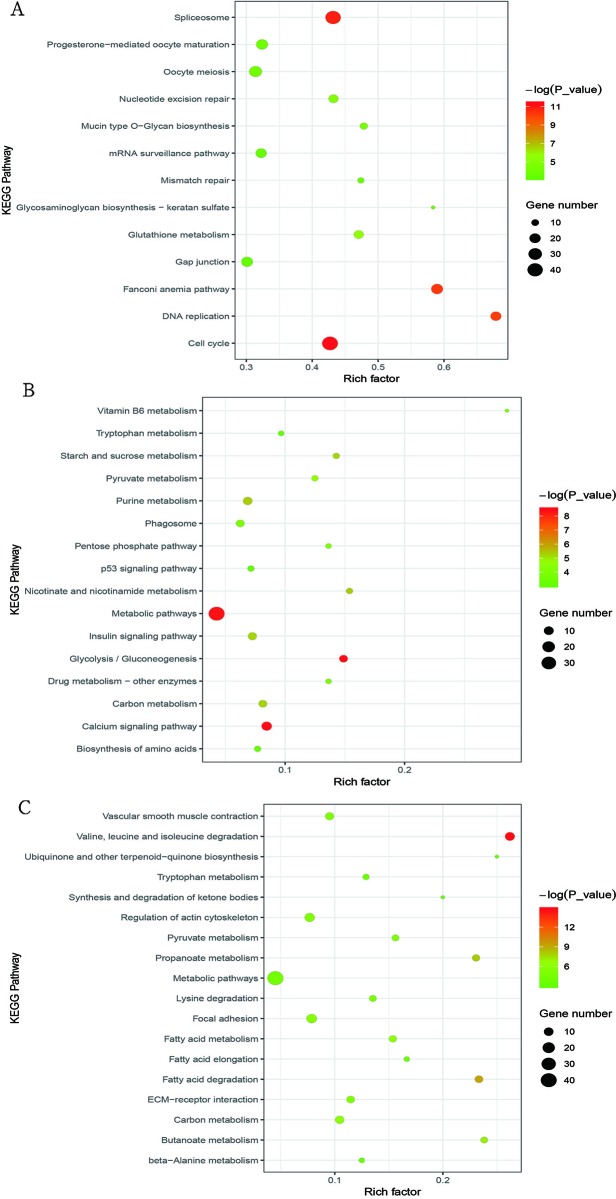
Figure 4.
Bubble plot of significantly enriched pathways for cluster I (profiles 8 and 12) with downregulated pattern (A), cluster II (profiles 39 and 49) with upregulated pattern (B), and cluster III (profile 25) (C). Bubble color and size correspond to the P value and gene number enriched in the pathway. The rich factor indicates the ratio of the number of DEGs mapped to a certain pathway to the total number of genes mapped to this pathway.

