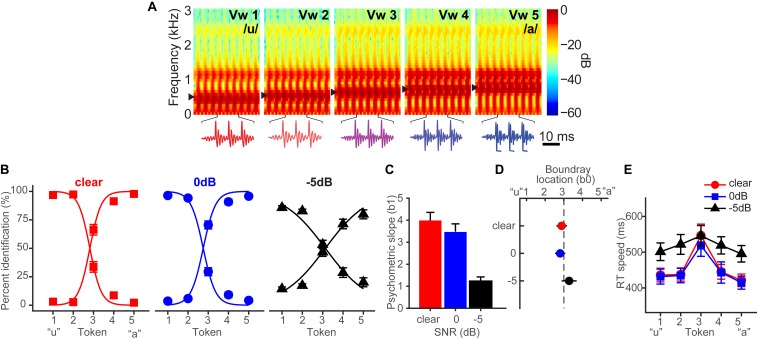
FIGURE 1.
Spectrograms and behavioral speech categorization at three levels of signal-to-noise ratio (SNR). (A) Spectrograms of individual speech tokens. (B) Perceptual psychometric functions. Note the curves are mirror symmetric reflecting the percentage of “u” (left curve) and “a” identification (right curve), respectively. (C) Slopes and (D) locations of the perceptual boundary show that speech categorizing is robust even down to 0 dB SNR. (E) Speech classification speeds (RTs) show a categorical slowing in labeling (Pisoni and Tash, 1974; Bidelman and Walker, 2017) for ambiguous tokens (midpoint) relative to unambiguous ones (endpoints) in unmasked and 0 dB SNR conditions. Categorization accuracy and speed deteriorate with noise interference by remains possible until severely degraded SNRs. Data reproduced from Bidelman et al. (2019b). Spectrogram reproduced from Bidelman et al. (2014), with permission from John Wiley & Sons. errorbars = ± SEM.

