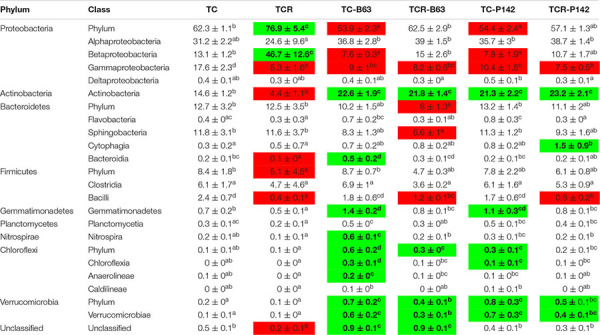
TABLE 1.
Relative abundance of dominant phyla and classes in the rhizosphere of tomato affected by the pathogen R. solanacearum and/or inoculation (average ± standard error of the mean, n = 4 per treatment).
 |
Number shows the average percentage followed by ± standard deviation (n = 4). Treatments sharing the same letters are non-significantly different (p < 0.05, ANOVA under generalized linear model followed by Tukey’s Honest Significant Detection test). Significant increases in abundance compared to the TC are highlighted in green, while significant decreases are highlighted in red.
