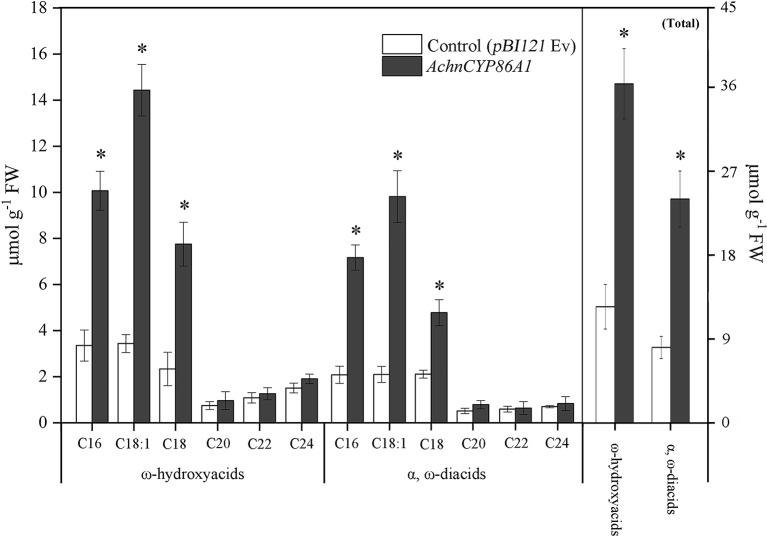
Figure 4.
The contents of ω-hydroxyacids and α, ω-diacids, and the total amounts from control (pBI121 Ev, empty vector) and AchnCYP86A1-infiltrated N. benthamiana leaves. Error bar represents the standard deviation of three biological replicates. Asterisk indicates significant difference (t test, *p value < 0.05).

