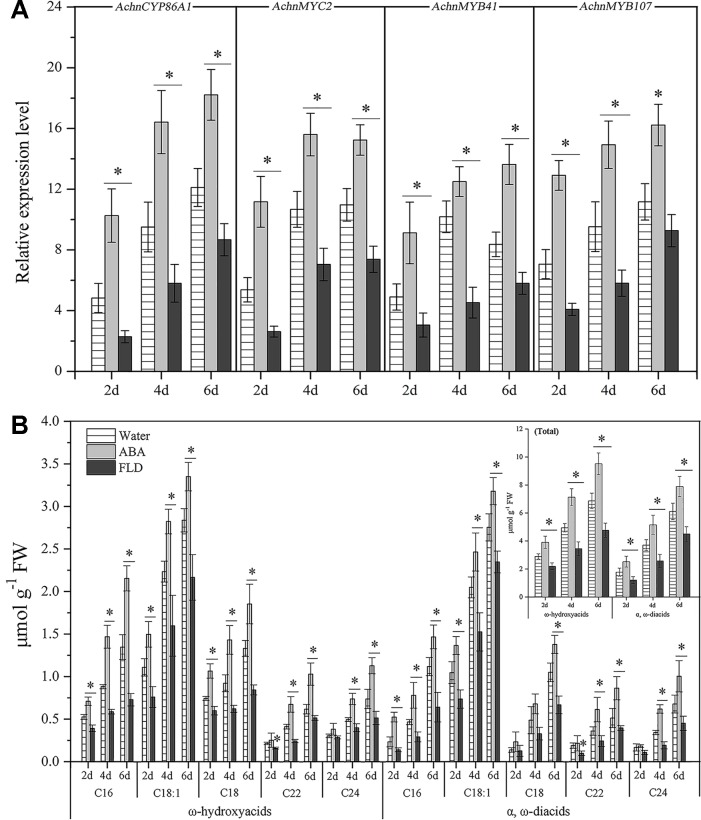
Figure 9.
Genes expression and the content of ω-hydroxyacids and α, ω-diacids in kiwifruit wound tissues treated with water, ABA and FLD. (A) Expression levels of AchnCYP86A1, AchnMYC2, AchnMYB41 and AchnMYB107. Relative mRNA abundance was evaluated by qRT-PCR and presented as fold change relative to the initial value upon wounding. (B) Accumulation of ω-hydroxyacids and α, ω-diacids. Inset graph shows total content of ω-hydroxyacids and α, ω-diacids. ABA, abscisic acid; FLD, fluridone. Error bar represents the standard deviation of three biological replicates. Asterisk indicates significant difference (t test, *p value < 0.05).

