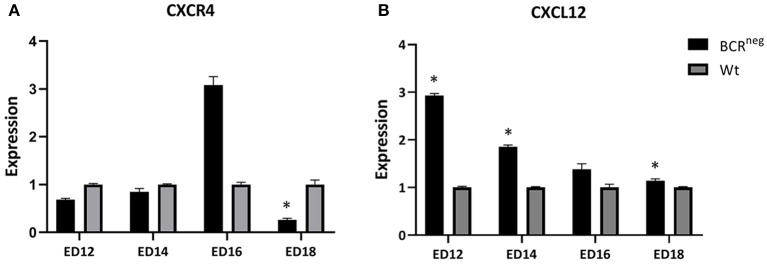
Figure 6.
Expression of CXCR4 and CXCL12 in the embryonic bursa of BCRneg in comparison to the wt embryonic bursa from ED12 to ED18. Bursae of BCRneg and wt embryos were prepared every second day from ED12 and on, till ED18. The RNA was isolated and cDNA was generated to perform qPCR in order to examine the levels of expression in the BCRneg embryos only in comparison to the wt embryos. The diagram is not representing the expression in wt embryos throughout the time, but the BCRneg in comparison to the wt on every time point. Expression levels were calculated using the ddCT method and is represented as 2−ddCT. Error bars show the SEM dCT values (ED12 and ED14: Wt n = 4 and BCRneg n = 3, ED16: WT and BCRneg n = 3, ED18: Wt n = 3, and BCRneg n = 5. Data is in all cases normally distributed per Shapiro-Wilk and Kolmogorov-Smirnov tests. *Depicts significance in the dCT values difference per Levene test, p < 0.05).

