FIGURE 6.
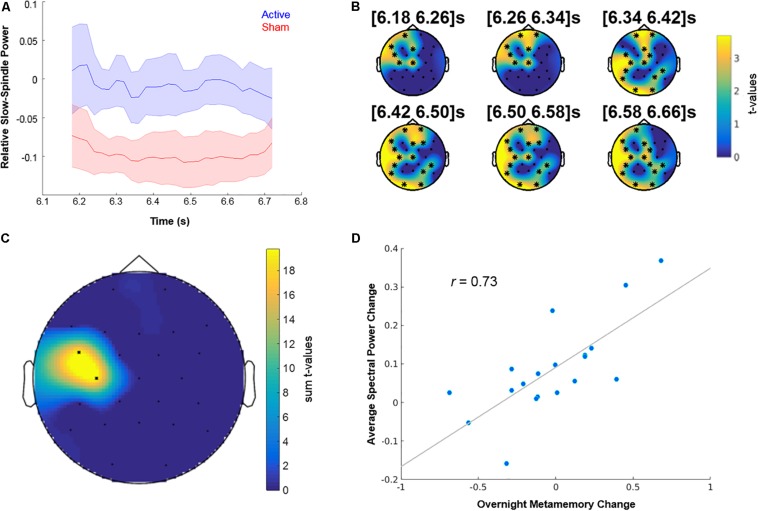
Neurophysiological and behavioral effects of STAMPs. (A) Dynamics of spectral power changes for the slow-spindle (8–12 Hz) “contrast cluster,” relative to the offset of SW events, showing significant differences between “Active” and “Sham” Night 2. (B) Scalp topography of t-values for the slow-spindle “contrast cluster” (clusterwise p = 0.025, additionally corrected for five frequency band comparisons) at six time points within the significant window (6.18–6.7 s following the offset of SW events). EEG channels participating in the cluster are marked by asterisks. (C) Scalp topography of summed t-values for the slow-spindle “correlation cluster” (clusterwise p = 0.013) from significant time bins. (D) Correlation of the differences in average spectral power change between “Active” and “Sham” Night 2 from “correlation cluster” bins and the differences in overnight metamemory change between “Tag & Cue” and “Sham” episodes (r = 0.73). Dots correspond to data from individual subjects (N = 19).

