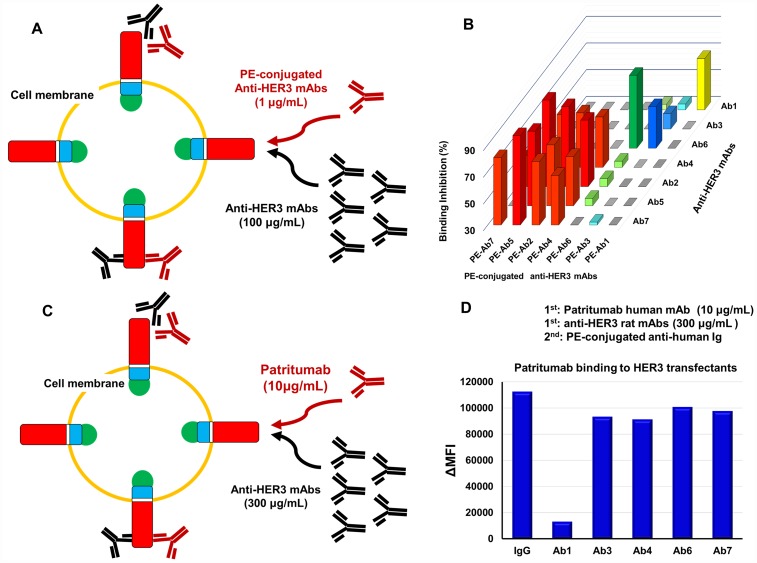
Figure 4. Epitope analysis of anti-HER3 rat mAbs and Patritumab.
(A) Scheme for the epitope analysis of anti-HER3 rat mAbs with HER3 transfectants. (B) 3D bar graph for the binding inhibition (%) by all combinations of anti-HER3 rat mAbs. (C) Scheme for the Patritumab binding in the presence of excess anti-HER3 rat mAbs. (D) Binding of Patritumab to transfectants in the presence of control rat IgG or anti-HER3 rat mAbs.

