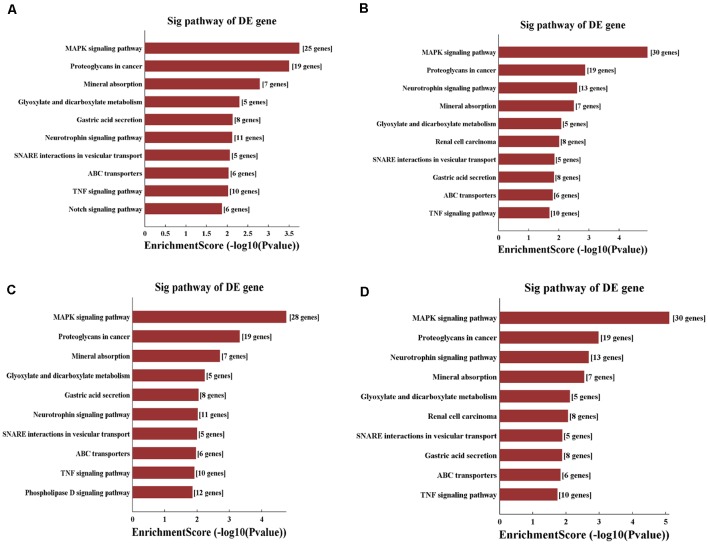
Figure 8.
KEGG pathway analysis of the target mRNAs regulated by the four candidate tsRNAs. (A) The bar plot shows the top 10 enrichment score values of the significantly enriched pathway for tiRNA-Gly-GCC-001. (B) The bar plot shows the top 10 enrichment score values of the significantly enriched pathway for tRF-Gly-GCC-012. (C) The bar plot shows the top 10 enrichment score values of the significantly enriched pathway for tRF-Gly-GCC-013. (D) The bar plot shows the top 10 enrichment score values of the significantly enriched pathway for tRF-Gly-GCC-016.

