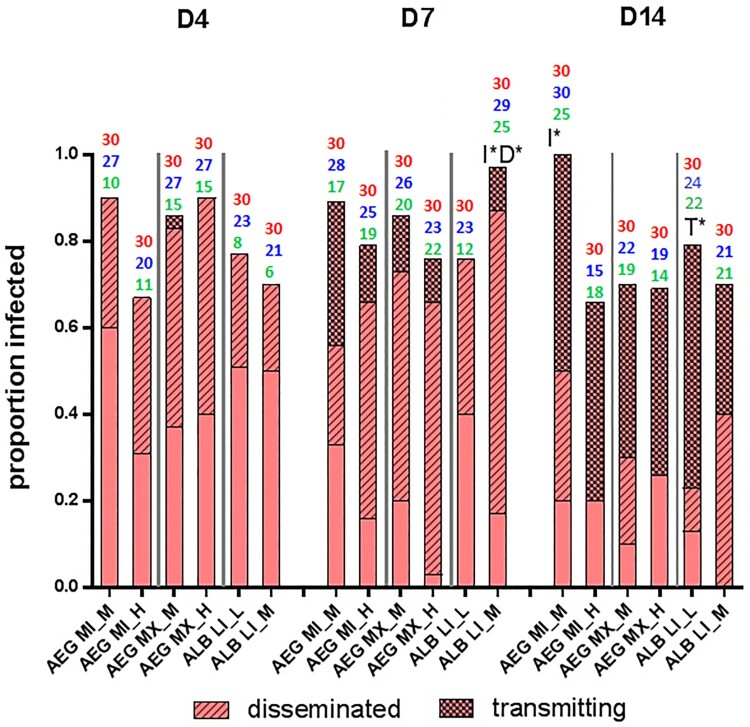
Figure 3.
Vector competence of Aedes mosquitoes infected with Zika virus and reared at different temperature regimes.
Note: The height of the bar plot represents the proportion of blood-fed individuals successfully infected with Zika virus. Above each bar plot, the total number of females screened for infection is indicated in red, the total number screened for dissemination, blue and transmission, green. The proportion of these that disseminated and subsequently transmitted the virus are further indicated. The temperature affected infection and dissemination rates in a population and species-specific manner. Increased temperature reduced the infection rates of AEG MI at the last time point (14 dpi) [Fisher’s exact test P < .05]. The opposite effect was measured in ALB LI, with significantly higher infection [Fisher’s exact test P < .05] and dissemination rates [Fisher’s exact test P < .05] with an increase in temperature at 7 dpi. The ALB LI (L) population had the highest transmission efficiency [Fisher’s exact test P < .05]. I* represents significantly different infection rates P < .05; D* represents significantly different dissemination rates P < .05; T* represents significantly different transmission efficiency P < .05, when comparing among temperature regimes.

