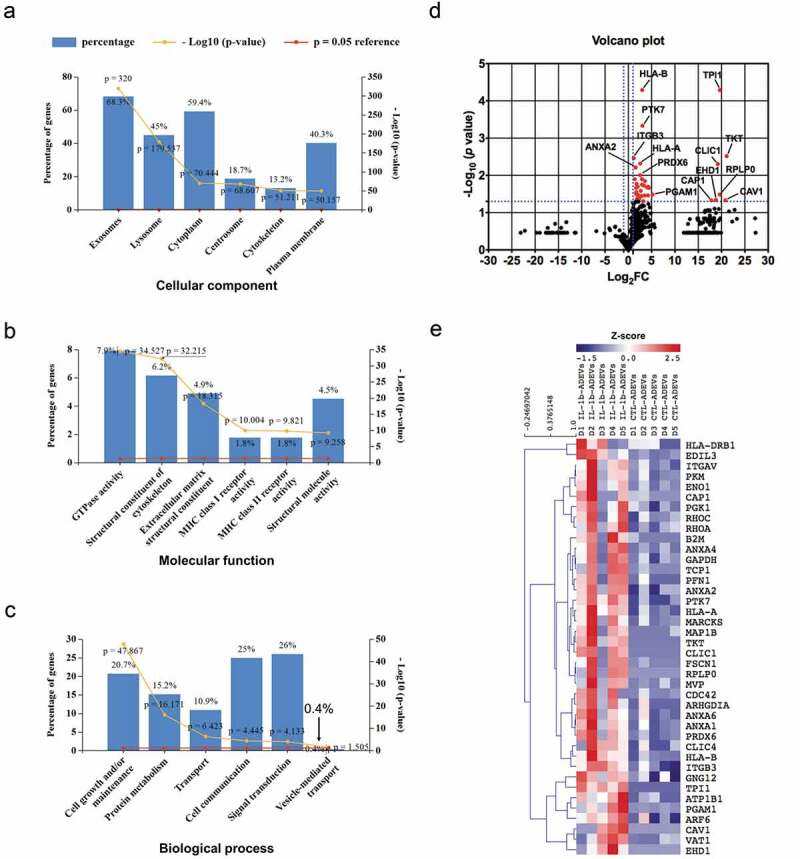
Figure 3.

The proteome profile of CTL- and IL-1β-ADEVs. A total of 875 proteins were identified by mass spectrometry. All identified proteins were submitted to the GO classification system using Funrich analysis. (a–c) The percentage of proteins in the six most enriched categories and the enrichment significance (−log10 (p-value), p < 0.05) of identified proteins in (a) cellular components, (b) molecular functions, and (c) biological process categories were identified. The percentage of proteins identified in each category is indicated. (d) Volcano plot of the proteomic data between CTL- and IL-1β-ADEVs. Y axis of the plot represents significance (−log10 of p value) and the x axis shows the log2 of the fold-change (expression in IL-1β-ADEVs/expression in CTL-ADEVs). The red dots represent the proteins that are significantly upregulated in the IL-1β-ADEVs compared to CTL-ADEVs. The fold changes of proteins not statistically significant are represented as black dots. The dashed blue lines represent a criteria of p < 0.05 (−log10 (p value) >1.3) and fold change >2 (log2 FC >1 or <−1). The proteins with – log10 (p value) >2 or log2 FC> 5 are indicated. (e) Heatmap of 40 significantly upregulated proteins in IL-1β-ADEVs (n = 5) versus CTL-ADEVs (n = 5) using quantitative iBAQ value, with depletion depicted in blue and enrichment in red.
